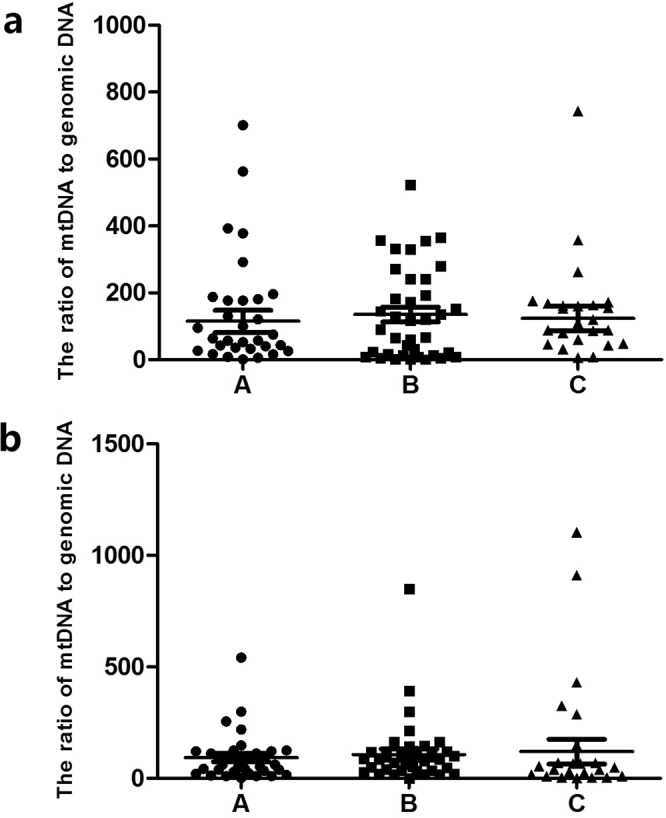
Figure 3.

Corresponding mt/gDNA ratio in embryo culture medium when the score of ICM is different. At D3, the mt/gDNA ratio corresponding to different score of ICM in the embryo culture medium (a). Mt/gDNA ratio corresponding to different score of ICM in D5 embryo culture medium (b). According to the scores of ICM in each blastocyst (A–C), the samples were divided into three groups, A, B, and C, such as the abscissa. The ordinate represents the ratio of mt/gDNA in the culture medium. One black dot, black triangle or black square represents one sample. Data are means ± SEM.
