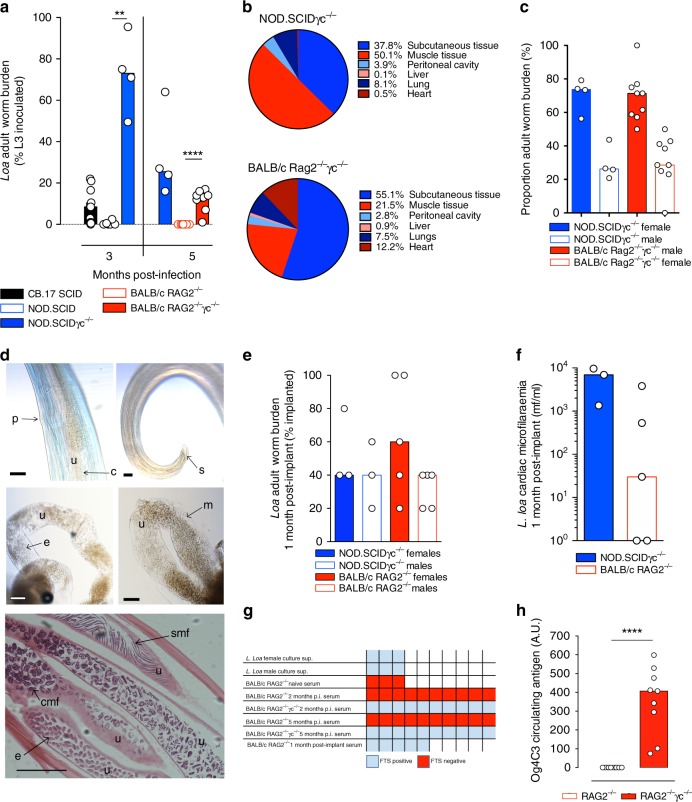
Fig. 1.
Chronic L. loa infection can be achieved in lymphopenic mice deficient in the common gamma chain. a L. loa adult worm burdens at 3 and 5 months post infection in lymphopenic mouse strains with or without compound IL-2/7 gamma chain (γc) deficiency (3 months: CB.17 SCID (n = 11), NOD.SCID (n = 6), NOD.SCIDγc−/− (n = 4). 5 months: NOD.SCIDγc−/− (n = 4), BALB/c RAG2−/ (n = 10), BALB/c RAG2−/−γc−/− (n = 9 mice)). Plotted is percentage adult recovery of infectious inoculum for individual mice and median levels. b Tissue distributions of adult L. loa in NOD.SCIDγc−/− (n = 4) or BALB/c RAG2−/−γc−/− (n = 9) mice, 5 months post infection. Plotted is mean percentage of total yields per tissue site. c Sex ratio of adult L. loa in NOD.SCIDγc−/− (n = 4) or BALB/c RAG2−/−γc−/− (n = 9) mice, 5 months post infection. Plotted is percentage adult recovery of infectious inoculum for individual mice and median levels. d Representative photomicrographs of L. loa female (upper left and middle pictures) and male (upper right) worms recovered from an infected BALB/c Rag2−/−γc−/− mouse at 5 months post infection. u uterus, p uterine pore, c coiled microfilariae, m microfilariae, s spicule. Scale bar = 1 cm. The micrograph at the bottom represents an hematoxylin/eosin staining of a paraffin-embedded section of a L. loa female worm recovered 1 month post implant in a BALB/c Rag2−/− mouse. u uterus, e embryos, smf stretched microfilariae, cmf coiled microfilariae. Scale bar: 0.2 mm. e Adult worm yield 1 month post adult implants in NOD.SCIDγc−/− and BALB/c Rag2−/− mice, n = 3–5. f Microfilariae production 1 month post-adult implants in NOD.SCIDγc−/− (n = 3) or BALB/c Rag2−/− mice (n = 5). g Summary table of filariasis test strips (FTS) outcome when testing worms culture supernatants after overnight incubation at 37 °C (n = 3 cultures) and mice sera from selected infection conditions, (n = 3 naive mice, n = 5 BALB/c Rag2−/− mice 1 month post implantation, n = 10 all other mouse infections). h Og4c3 quantitative circulating antigen at 5 months post infection, (n = 10 BALB/c Rag2−/− or n = 9 BALB/c RAG2−/−γc−/− mice). Plotted is individual data and median levels. Significant differences between strains are determined by two-tailed Mann–Whitney (two groups) or Kruskal–Wallis with Dunn’s post-hoc tests (>two variables). Significance is indicated: *p < 0.05, **p < 0.01, ****p < 0.0001

