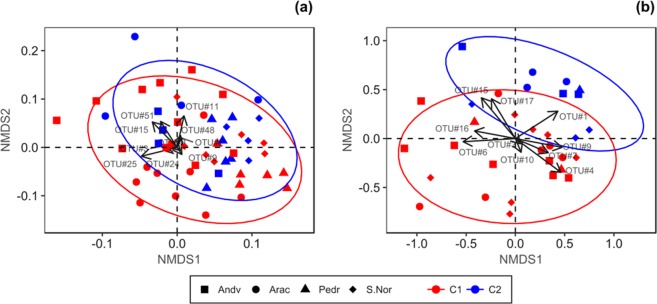
Figure 5.
Non-metric multidimensional scaling analysis of OTUs abundance influence in defoliation levels and site location, for the 26 studied plots on Quercus ilex dehesas of the Andalusian Network for Damage Monitoring in Forest Ecosystems. (a) Analysis for fungi dataset. (b) Analysis for oomycete dataset. Ellipsoid indicates normal probability of point distribution at 90% confidence level for mean defoliation classes of plots. Arrows show influence vectors for the ten most abundant OTU’s of fungi and oomycete dataset.

