Fig. 1.
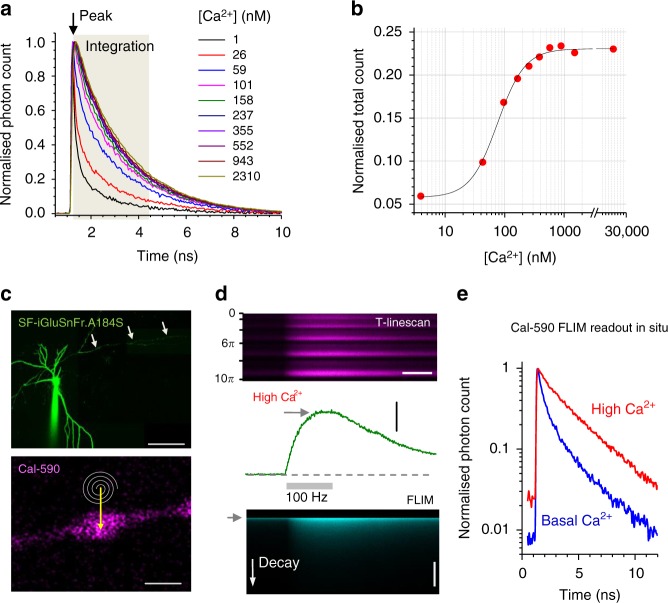
Fluorescence lifetime of Cal-590 provides readout of low intracellular Ca2+. a Fluorescence lifetime decay curves of Cal-590 in a series of calibrated [Ca2+]-clamped solutions finely adjusted to include appropriate intracellular ingredients13,14 (Methods). Fluorescence lifetime traces are normalised to their peak values (at ~1.3 ns post-pulse); the area under the curve over the time interval of 3 ns (tan shade) was measured and related to the peak value thus providing normalised total count (NTC) readout; λx2p = 910 nm; temperature 33 °C. b The Cal-590 fluorescence lifetime imaging microscopy (FLIM) [Ca2+] sensitivity estimator, NTC, fitted with sigmoid-type function (χ2 = 2.11 × 10⁻⁵, R2 = 0.996). c Top: Example of a CA3 pyramidal cell (SF-iGluSnFR channel); arrowheads, proximal part of the traced axon; patch pipette is seen. Bottom: Example of an axonal bouton (Cal-590 channel) traced from the cell soma; spiral line and arrow, tornado linescan applied in the middle of the bouton; scale bar, 50 µm (top) and 1 µm (bottom). d Example of a single-bouton Cal-590 signal during a 500-ms 100-Hz burst of spike-inducing somatic 1 ms current pulses: recorded as a tornado linescan (top; ordinate, spiral rotation angle 0–10π reflects five concentric spiral circles, 2π radian/360° each), fluorescence intensity (integrated over the 10π spiral scan) time course (middle), and fluorescence decay (FLIM, bottom; ordinate, decay time; grey arrowhead, laser pulse onset). Scale bars, 300 ms (top, horizontal), 2.0 ΔF/F (middle, vertical), 5 ns (bottom, vertical). e Intra-bouton Cal-590 fluorescence decay time course (normalised to peak) representing basal [Ca2+] (blue) and peak [Ca2+] (red), in the experiment shown in d

