Fig. 3.
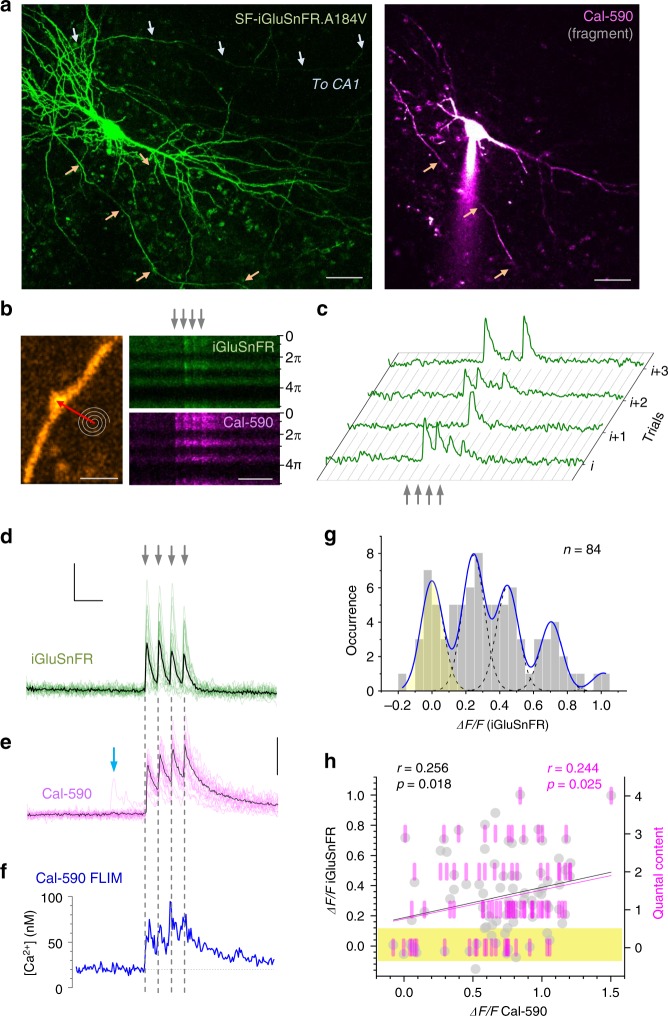
Multiplex imaging of quantal glutamate release and presynaptic Ca2+ dynamics. a CA3 pyramidal cell. Left: SF-iGluSnFR.A184V channel7 (Methods); arrows, two main axonal branches; ~60 µm z-stack, λx2p = 910 nm. Right, Cal-590 channel (~20 µm z-stack fragment), whole-cell (300 µM Cal-590); patch pipette seen; scale bars, 20 µm. b Axonal bouton traced into CA1 from CA3 pyramid9,49 : left, SF-iGluSnFR.A184V channel; tornado scan position shown; right, tornado linescan examples (rotation angle 0–5π rad reflects 2.5 spiral circles) during four evoked action potentials (APs; 20 Hz, arrows) shown in SF-iGluSnFR.A184V (green, note release failures) and Cal-590 (magenta) channels; scale bars, 2 µm (left), 200 ms (right). c Four characteristic sequential one-sweep recordings (SF-iGluSnFR channel) depicting individual quantal releases and failures. d Summary, glutamate release kinetics in bouton shown in b (SF-iGluSnFR.A184V channel; green, 20 trials 1 min apart; black, average); scale bars, 50% ΔF/F (vertical) and 100 ms (horizontal). e Summary, Cal-590 intensity signal ΔF/F (red channel) recorded as in d (magenta, individual trials; black, average); arrow, spontaneous Ca2+ entry with no glutamate release (see d); scale bar, 30% ΔF/F. f Dynamics of free presynaptic [Ca2+] averaged over 20 trials: Cal-590 fluorescence lifetime imaging microscopic readout (normalised photon count), converted to [Ca2+]. Note: data reflect free ion concentration volume-equilibrated and time-averaged over 5–10 ms. g Amplitude histograms (SF-iGluSnFR.A184V ΔF/F signal, first–to-fourth response counts combined; 8 ms pre-AP baseline subtracted); blue line, semi-constrained multi-Gaussian fit (Methods); peaks correspond to quantal amplitudes; leftmost peak, zero signal (release failure noise; yellow shade); false-positive cut-off at ~0.12 ΔF/F. h Trial-to-trial glutamate release signal amplitude (bouton in b) shown as ΔF/F SF-iGluSnFR.A184V readout (grey dots) and as quantal content (magenta bars, right ordinate; calculated from histogram in g) plotted against evoked Ca2+ entry signal (ΔF/F Cal-590, as in e) for all recorded APs (8 ms pre-AP baseline subtracted). Black and magenta lines, linear regressions (r, Pearson’s correlation; p, regression slope significance) for ΔF/F and quantal content data, respectively; yellow shade, failure response cut-off (as in g)

