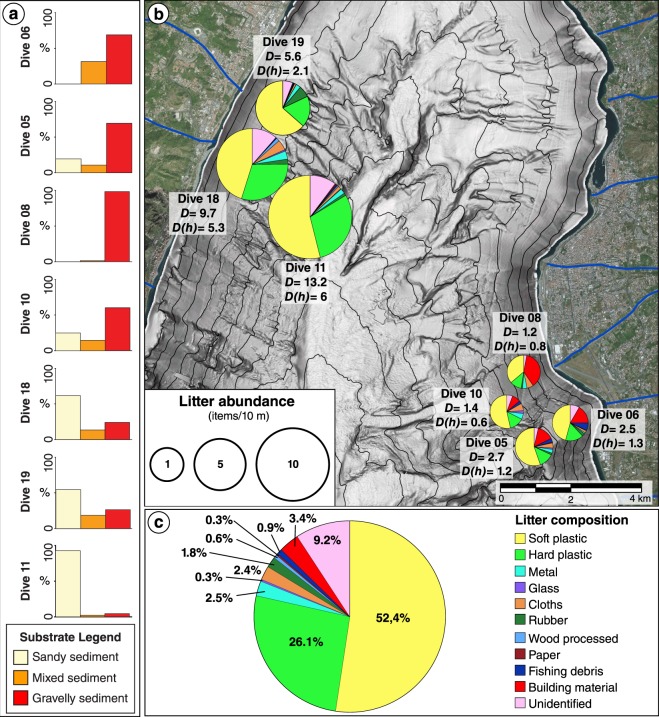
Figure 2.
Seafloor characteristics, distribution and composition of marine litter. (a) Seafloor types and (b), categories of marine litter for each transect (location in Fig. 1). The size of the pie charts in (b) is proportional to litter abundance (D = total litter density and D(h) = litter density of heavy items, both expressed as items/10 m). (c) Overall composition of marine litter observed along all ROV dives in the Messina Strait canyons. The map in (b) was generated with QGIS Version 2.18 (https://www.qgis.org/it/site). The satellite imagery was obtained from the Bing Aerial maps, using the QGIS OpenLayers plug-in (https://github.com/sourcepole/qgis-openlayers-plugin).

