Fig. 1.
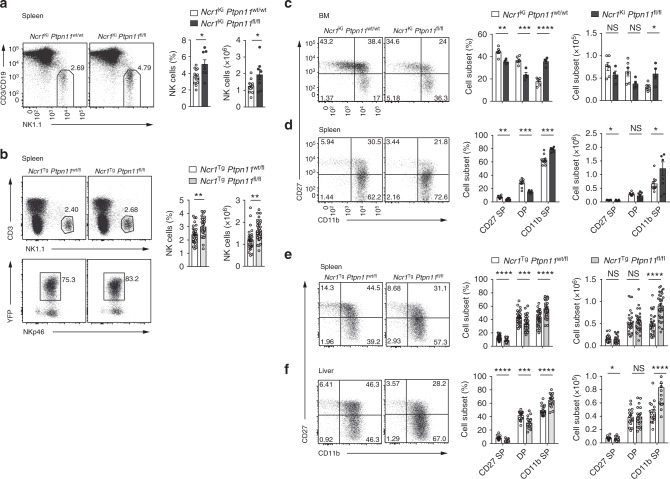
Loss of Shp-2 leads to increased mature NK cell numbers. a, b Representative flow cytometric image, frequency, and number of splenic NK cells (gated as NK1.1+CD3/CD19−) of Ncr1Ki Ptpn11fl/fl (dark gray) and control mice (white) are depicted (a) or of splenic NK cells (gated as NK1.1+CD3−YFP+NKp46+) of Ncr1Tg Ptpn11fl/fl (light gray) or Ncr1Tg Ptpn11wt/fl (white) mice (b) are depicted. c, d Analysis of NK cells from Ncr1Ki Ptpn11fl/fl and control mice. c Representative cytometric plot of BM NK cells (gated as CD122+NK1.1+NKp46+CD3/CD19−) stained with CD27 and CD11b; percentage and number of CD27 single-positive (CD27 SP; CD27+CD11b−), double-positive (DP; CD27+CD11b+), and CD11b single-positive (CD11b SP; CD27−CD11b+) populations are shown. d Representative cytometric plot of splenic NK cells (gated as NK1.1+ NKp46+CD3/CD19−) stained with CD27 and CD11b; percentage and number of the afore-mentioned subsets are shown. e As in (d), but for NK cells gated as NK1.1+CD3−YFP+NKp46+ from Ncr1Tg Ptpn11fl/fl or Ncr1Tg Ptpn11wt/fl mice. f Frequency and number of CD27 SP, DP, and CD11b SP conventional NK cells (gated as CD45+NK1.1+CD3−YFP+NKp46+DX5+CD49a−) from Ncr1Tg Ptpn11fl/fl and control mice in the liver and a representative staining of CD27 and CD11b expression. a, b Results represent the mean ± SEM of n = 8 (Ncr1Ki Ptpn11fl/fl) and n = 13 (Ncr1Ki Ptpn11wt/wt) (a), n = 29 (Ncr1Tg Ptpn11wt/fl) and n = 35 (Ncr1Tg Ptpn11fl/fl) (b) mice per genotype, are a pool of three (a) and nine (b) experiments, which are representative of at least five (a) and eleven (b) independent experiments. c–f Results represent mean ± SEM of n = 4 (Ncr1Ki Ptpn11fl/fl) and n = 6 (Ncr1Ki Ptpn11wt/wt) (c), n = 7 (Ncr1Ki Ptpn11fl/fl) and n = 10 (Ncr1Ki Ptpn11wt/wt) (d), n = 29 (Ncr1Tg Ptpn11wt/fl) and n = 35 (Ncr1Tg Ptpn11fl/fl) (e), and n = 16 (Ncr1Tg Ptpn11wt/fl) and n = 20 (Ncr1Tg Ptpn11fl/fl) (f) mice per genotype, are a pool of two (d), nine (e, f) experiments and representative of at least three (c, d), and eleven (e, f) independent experiments. Statistical comparisons are shown; *p ≤ 0.05, **p ≤ 0.01, ***p ≤ 0.001, ****p ≤ 0.0001, NS, non-significant; Student’s t-test. Source data are provided as a Source Data file

