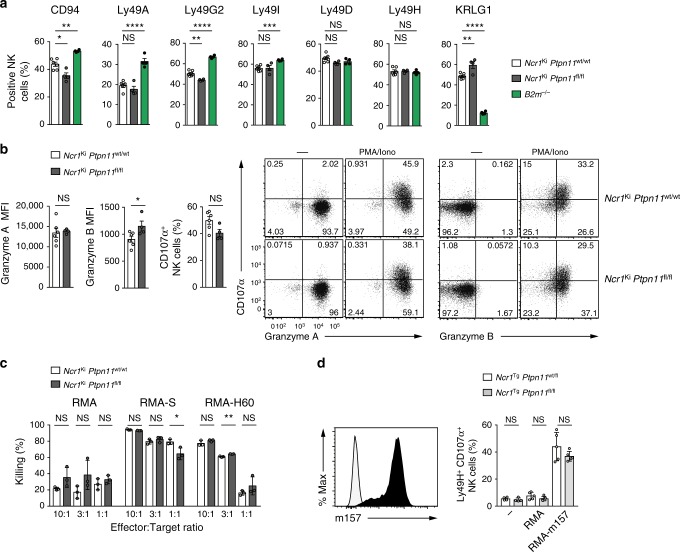
Fig. 2.
Shp-2 is largely dispensable for NK cell effector functions. a Graphs depict percentages of CD94+, Ly49A+, Ly49G2+, Ly49I+, Ly49D+, Ly49H+, and KLRG1+ splenic NK cells (gated as NK1.1+ CD3/CD19−) from Ncr1Ki Ptpn11wt/wt (white), Ncr1Ki Ptpn11fl/fl (dark gray), and B2m−/− (green) mice. b Graph and a representative cytometric plot illustrate the production of granzyme A and B by splenic NK cells (gated as NK1.1+NKp46+CD3/CD19−) after phorbol 12-myristate 13-acetate and ionomycin stimulation (PMA/Iono). c NK cells isolated from polyinosinic:polycytidylic acid (polyI:C)-treated Ncr1Ki Ptpn11wt/wt or Ncr1Ki Ptpn11fl/fl mice were plated with RMA, RMA-S, or RMA-H60 cells at the indicated ratios. The graph depicts percentage killing of target cells, as measured by quantifying PI− living target cells. d Naive splenocytes from Ncr1Tg Ptpn11fl/fl (light gray) mice or heterozygote littermate controls (white) were incubated with RMA cells or RMA-m157 cells (expression of m157 is illustrated in the graph on the left). Percentage of YFP+Ly49H+CD107α+ NK cells in each group was determined by flow cytometry (illustrated in the graph on the right). a, b Results represent the mean ± SEM of n = 4 (Ncr1Ki Ptpn11fl/fl or B2m−/−) and n = 6 (Ncr1Ki Ptpn11wt/wt) mice per genotype and are representative of at least three (a) and two (b) independent experiments. c, d Results represent the mean ± SD of n = 3 (c), n = 4 (for non-stimulated conditions) and n = 5 (for RMA conditions) (d) technical replicates and are representative of at least two (c) and three (d) independent experiments. Statistical comparisons are shown; *p ≤ 0.05, **p ≤ 0.01, ***p ≤ 0.001, ****p ≤ 0.0001, NS, non-significant; Student’s t-test. Source data are provided as a Source Data file

