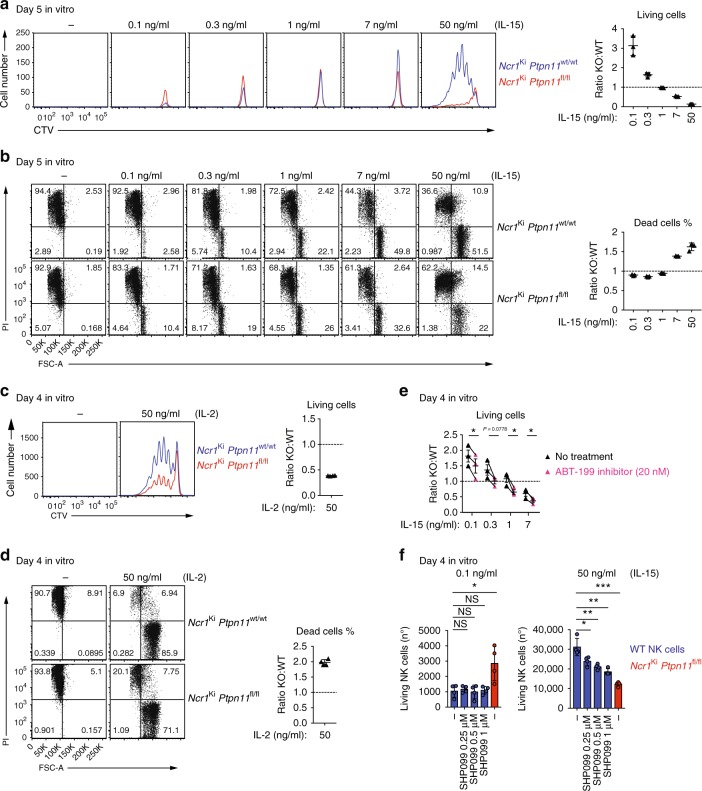
Fig. 3.
Ptpn11-deficient NK cells show a biphasic response to IL-15. a–d Enriched NK cells from Ncr1Ki Ptpn11wt/wt (blue; congenically marked) and Ncr1Ki Ptpn11fl/fl (red) mice were co-cultured for 5 days in the presence of the indicated amounts of IL-15 (a, b) or were co-cultured for 4 days with 50 ng/ml of IL-2 (c, d). a, c Histograms represent the amount and cell division (CTV dilution) of Shp-2-deficient and control NK living cells in each condition (quantitative flow cytometry acquisition) and ratios thereof. b, d Representative flow cytometry plots show the percentage of dead cells (PI+) among knockout and control NK cells and ratios thereof. e Enriched Shp-2-deficient and congenically marked control NK cells were co-cultured for 4 days in the presence of the indicated amounts of IL-15 and 0 (black triangles) or 20 nM ABT-199 (pink triangles). The graph depicts the ratio of living knockout over control NK cells. f Enriched NK cells from C57BL/6 wild-type mice (blue), or Shp-2-deficient NK cells from Ncr1Ki Ptpn11fl/fl mice (red) as control, were cultured for 4 days in the presence of 0.1 or 50 ng/ml IL-15 and 0, 0.25, 0.5, or 1 μM SHP099. Graphs depict the number of living (PI−) NK cells. Results represent the mean ± SD of n = 3 (a, b) and n = 4 (c, d, f) replicates, or of n = 3 independent experiments (e; average of each condition/experiment). Results are representative of at least five (a, c), two (b, d), or three (e, f) independent experiments. Statistical comparisons are shown in (e), (f); NS, non-significant, *p ≤ 0.05, **p ≤ 0.01, ***p ≤ 0.001; Student’s t-test unpaired (f) and Student’s t-test paired (e). Source data are provided as a Source Data file

