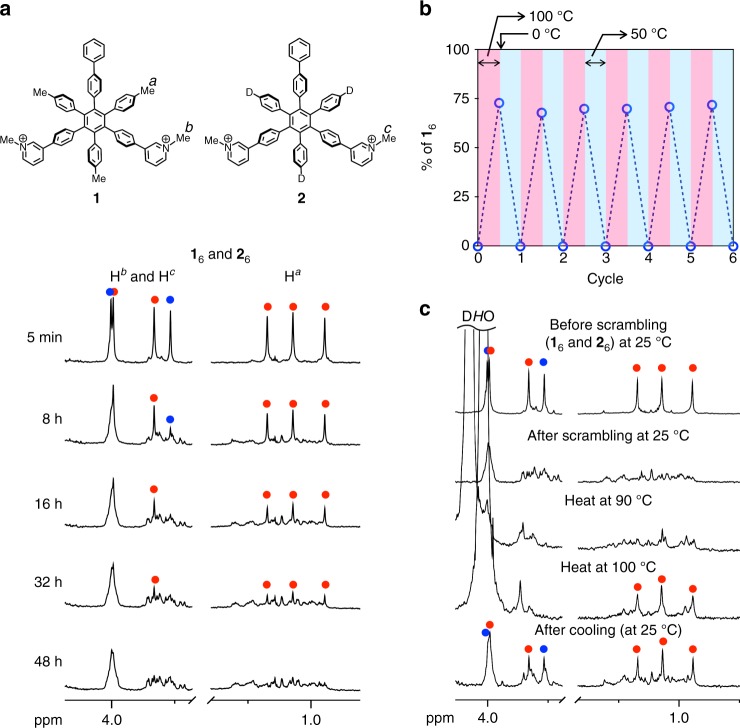
Fig. 3.
Scrambling and induced-sorting of GSAs between the nanocubes (16 and 26). The scrambling and induced-sorting were monitored by 1H NMR spectroscopy (500 MHz, D2O, p-tolyl methyl and N-methyl group regions, [1] = [2] = 0.4 mM). a The monitoring of the scrambling of GSAs between 16 and 26 at 298 K. Red and blue solid circles indicate the signals for 16 and 26, respectively. b A plot of the existence ratio of 16 in a 1:1 mixture of 1 and 2 during six cycles of the transitions between the ordered and disordered states by changing temperature. c 1H NMR monitoring of the transition in the first cycle. Red and blue solid circles indicate the signals for 16 and 26, respectively. The temperatures at which the measurements were carried out are indicated in the spectra

