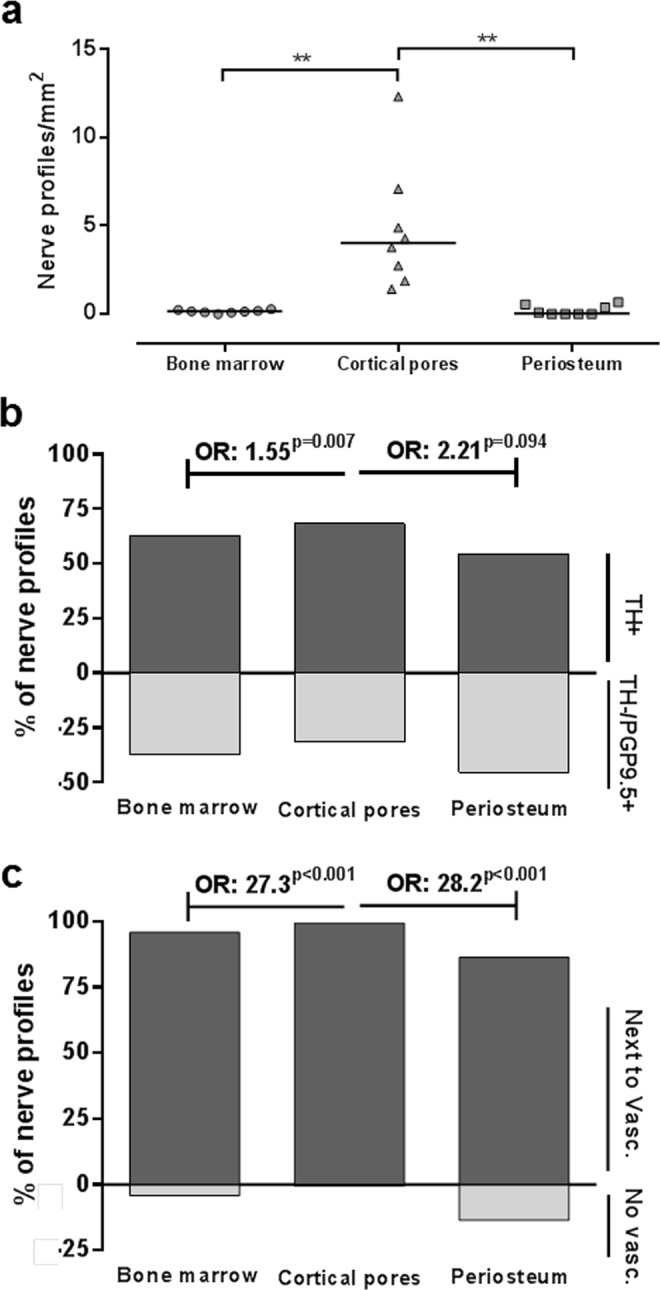
Figure 2.

Nerve profile density in bone sub-compartments and their association to the vasculature. (a) The number of nerve profiles per tissue area was significantly higher in the cortical pores compared to the bone marrow and periosteum. Each dot represents the value in a given biopsy (n = 10), and the horizontal line represents the mean. The data were analyzed by repeated measure ANOVA with Geisser-Greenhouse’s correction: **p < 0.01. (b) The percentage of TH+ nerve profiles relative to TH−/PGP9.5+ nerve profiles was higher in the cortical pores compared to the bone marrow and periosteum (not significant). The data was analyzed by a clustered logistic regression, addressing whether the odds between TH+ and TH−/PGP9.5+ nerve profiles were different between the compartments. (c) Most of the nerve profiles were closely associated with the vasculature. Still, the percentage of nerve profiles associated with vasculature relative to those without a vascular association was higher in the cortical pores compared to the bone marrow and periosteum. The data was analyzed by a clustered logistic regression, addressing whether the odds between nerve profiles with or without vascular association is different between the compartments. TH: tyrosine hydroxylase, PGP9.5: protein gene product 9.5, OR: odds ratio.
