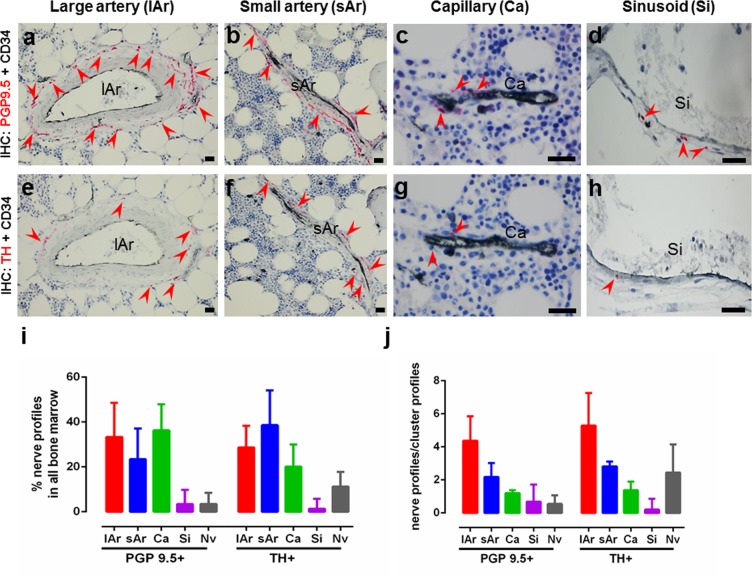
Figure 3.
Association of nerve profiles to the vasculature. (a–h) Images showing double immunostaining of CD34+ vasculature in combination with PGP9.5+ or TH+ nerve profiles (red arrows) in the bone marrow. Large arteries with PGP9.5+ (a) or TH+ (e) nerve profiles, small arteries with PGP9.5+ (b) or TH+ (f) nerve profiles, capillaries with PGP9.5+ (c) or TH+ (g) nerve profiles, and sinusoids with PGP9.5+ (d) or TH+ (h) nerve profiles. (i) The percentage distribution of PGP9.5+ and TH+ nerve profiles associated with the respective vascular structures in the bone marrow, and (j) the number of nerve profiles/cluster profile for the respective vascular structures. TH: tyrosine hydroxylase, PGP9.5: protein gene product 9.5; lAr: large arteriole; sAr: small arteriole; Ca: capillary; Nv: Nerve profiles with no association to the vasculature. n = 11.

