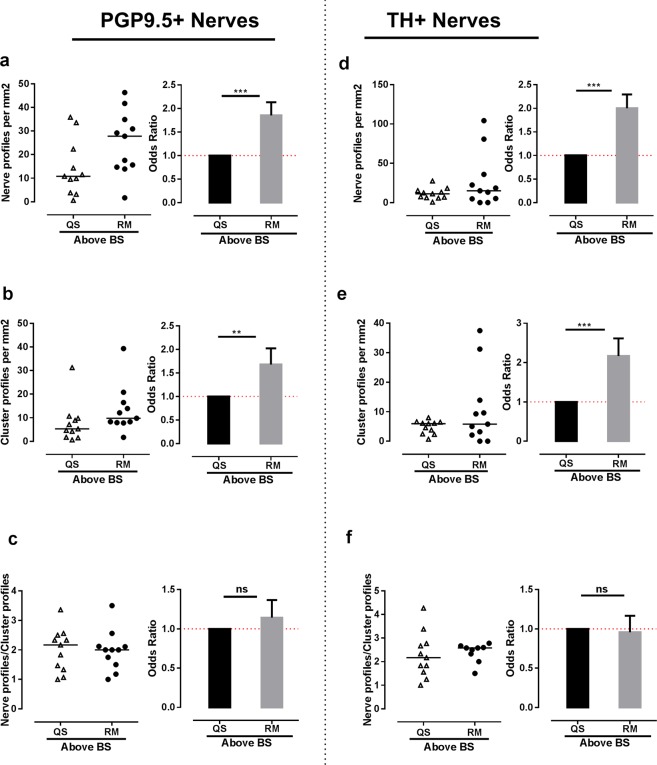
Figure 6.
Nerve profiles are more abundant above bone remodeling surfaces. In the bone marrow, nerve and cluster profiles were quantified 0–100 µm above bone remodeling and quiescent surfaces. (a,d) The density of PGP9.5+ (a) and TH+ (d) nerve profiles was significantly higher above the remodeling surfaces compared to quiescent surfaces. (b,e) The density of cluster profiles innervated by PGP9.5+ (b) and TH+ (e) nerve profiles was significantly higher above bone remodeling surfaces. (c,f) No difference was observed in the nerve profile/cluster profile ratio of the PGP9.5+ (c) and TH+ (f) innervation, indicating that the increase in innervation was not due to an increase in numbers of nerve profiles per vascular structure. The data was analyzed by clustered regression analysis. **p < 0.01, ***p < 0.001, n = 11. TH: tyrosine hydroxylase, PGP9.5: protein gene product 9.5.

