Fig. 1.
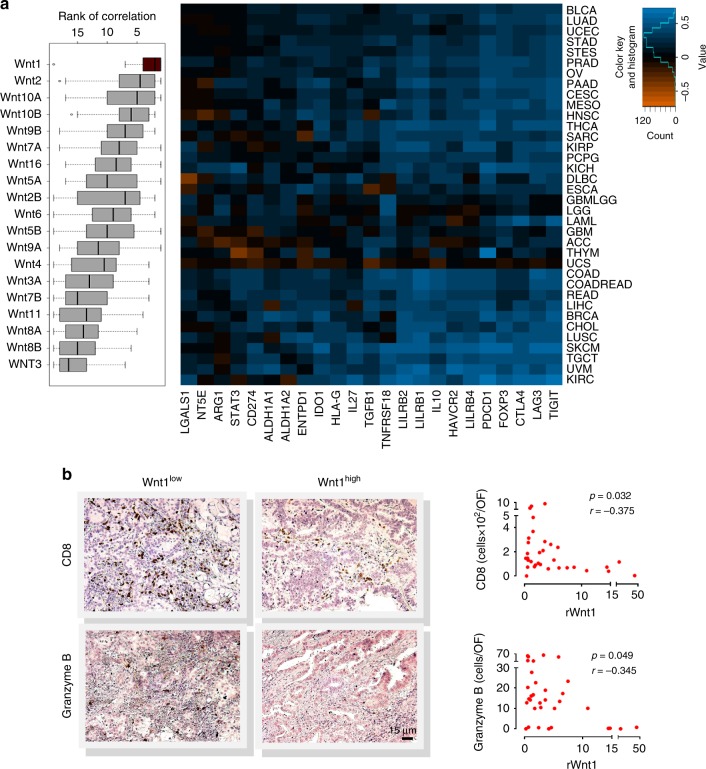
Upregulation of Wnt1 in adaptive immune resistant human tumors. a Distributions of the ranks of correlations between Wnt ligand gene expression and expression of 23 immunosuppressive genes across all cancer types of the TCGA dataset (>11,000 tumors) (Left) and heatmap representing color-coded Pearson correlations for Wnt1 (Right). Column side annotations are names of immunosuppressive genes and row side annotations are names of TCGA cancer types. b CD8+ T cytotoxic cells and granzyme B+ cells identified as brown stained cells by immunohistochemistry (IHC) in paraffin-embedded human tumor sections (Left). Scatterplots depicting the relationship between Wnt1 gene expression (RT-PCR) and numbers of CD8+ and granzyme B+ cells per tumor optical field (OF) (IHC). Pearson Correlation. (Right). Each point represents a single donor (n = 33). Source data are provided as a Source Data file

