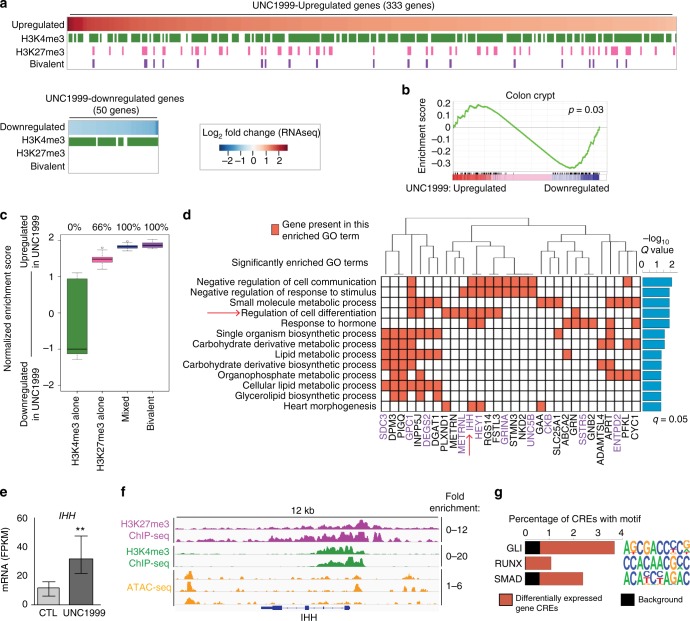
Fig. 4.
EZH2 Inhibition de-represses the colonic differentiation gene IHH. a RNA-seq heatmap of log2 fold change for all genes significantly upregulated (red in top panel) or downregulated (blue in bottom panel) following UNC1999 treatment in POP92 cells. Lower bars underneath the heatmap indicate ChIP-seq data for POP92 cells in the absence of UNC1999. The presence of H3K4me3 peaks (green), H3K27me3 peaks (pink) or regions where both marks directly overlap (Bivalent; purple) in promoter regions (2.5 kb upstream of TSS, 0.5 kb downstream of TSS) is shown (prior to UNC199 treatment) for all genes whose expression is significantly changed after UNC1999 treatment (negative binomial, FDR-corrected q < 0.05). RNA-Seq was performed in (n = 3) biological replicates for each condition, ChIP-seq peaks called in n = 2 separate replicates were used for each mark. b GSEA performed on the differentially regulated transcripts from RNA-seq data with respect to the Colon Crypt signature (FWER, p < 0.03). c GSEA performed on 30 randomly selected sets of 200 genes with H3K4me3 (green), H3K27me3 (pink), mixed (blue) or bivalent (purple) marks in their promoters. Distribution of normalised enrichment scores are shown along with the percentage of runs which were significantly enriched among upregulated genes following UNC1999 treatment (p < 0.25, none were significant among downregulated genes). d Enriched biological process GO terms within all genes differentially upregulated following UNC1999 treatment with H3K27me3 marks in their promoter. Matrix shows which differentially expressed genes are present in each GO category, barplot shows −log2 FDR-corrected q-value. Genes with bivalently marked promoters are highlighted in purple. e Boxplot of differential expression of IHH following UNC1999 treatment (mean of n = 3), error bars show max and min estimated FPKM values, Student’s t test. f Representative ChIP-Seq tracks for H3K27me3 and H3K4me3 showing read counts over the IHH locus inclusive of the promoter region. g Transcription factor motif analyses performed on the predicted CREs (defined using ATAC-Seq) of UNC1999-differentially upregulated genes using homer, relative to a background of all ATAC-Seq peaks. **P < 0.01

