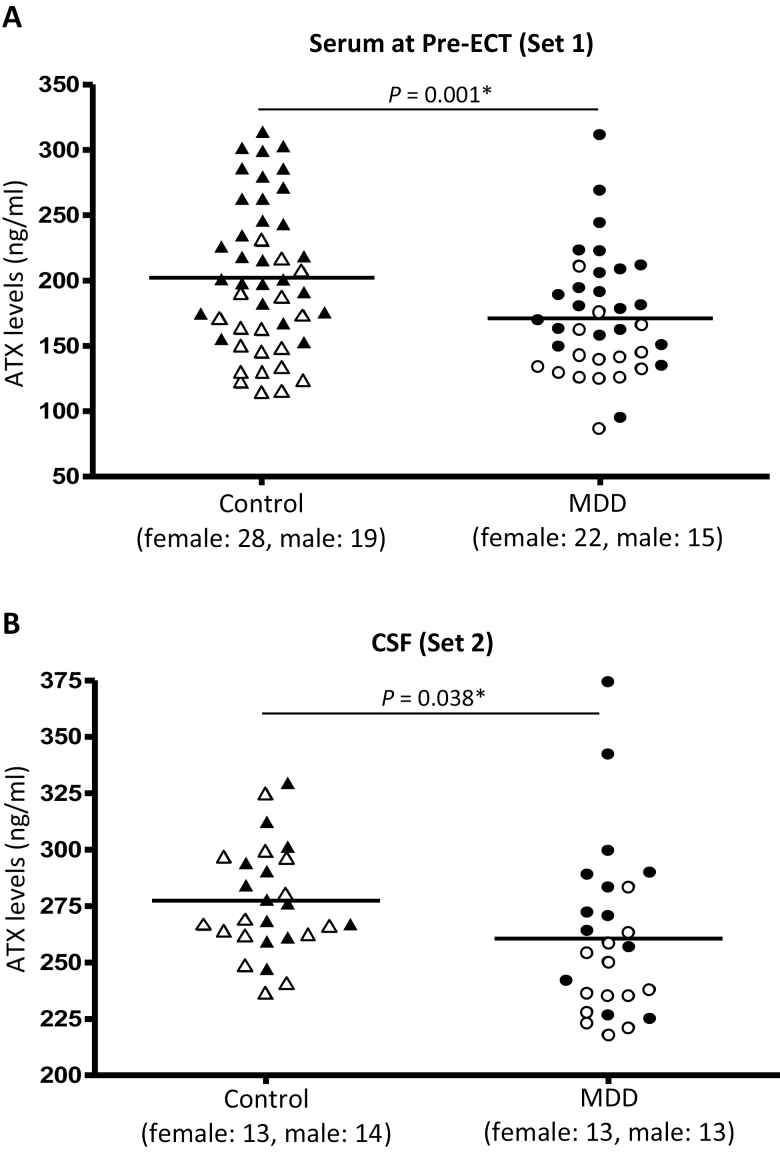
Figure 1.
Scatter plot of serum levels of autotaxin (ATX) (A) before a course of electroconvulsive therapy (ECT) and cerebrospinal fluid (CSF) levels of ATX (B) in control group (female: ▲; male: △) and major depressive disorder (MDD) group (female: ●; male: ○). Serum samples (Set 1) and CSF samples (Set 2) were collected from separate facilities. The horizontal bars represent the mean values adjusted for gender. *P < .05.

