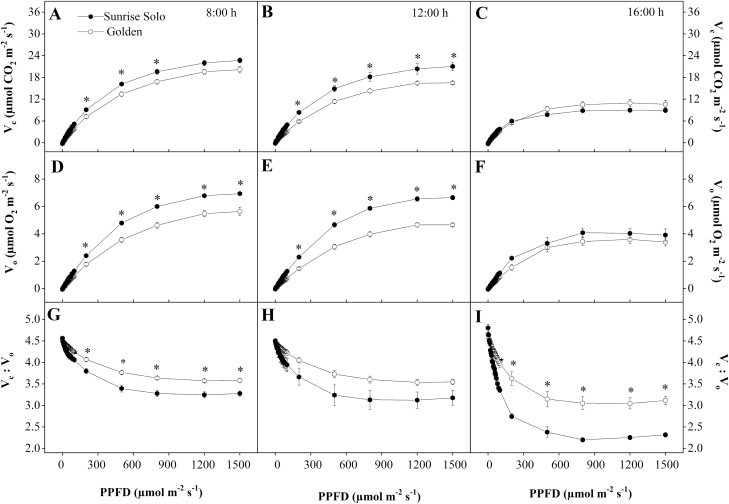
Figure 5.
RuBisCO carboxylation (Vc—A, B and C) and oxygenation (Vo—D, E and F) rates and Vc:Vo ratio (G, H and I) of two Carica papaya genotypes (Golden and Sunrise Solo) at 0800 (A, B and C), 1200 (D, E and F) and 1600 h (G, H and I). Each point represents the mean of four replicates. Bars represent the standard error. * indicates significant statistical difference by unpaired Student’s t-test at 5 % probability.

