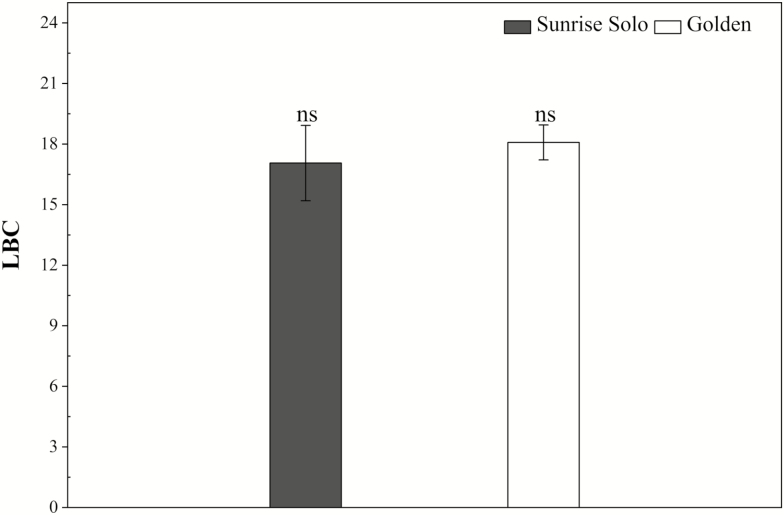
Figure 7.
Leaf carbon balance of two Carica papaya genotypes (Golden and Sunrise Solo) calculated using net photosynthetic rates (Anet) at 1200 μmol m−2 s−1 of PPFD. Each column represents the mean of four replicates. Bars represent the standard error. ns indicates no statistical difference by unpaired Student’s t-test at 5 % probability.

