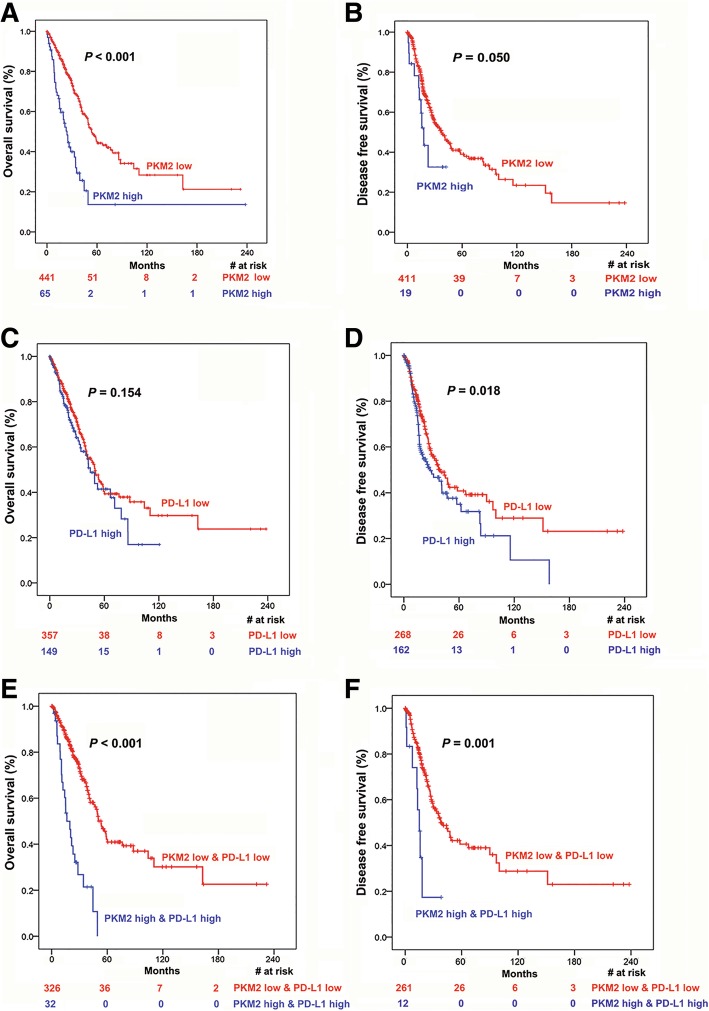
Fig. 4.
Prognostic analysis of PKM2 and PD-L1 expression in lung adenocarcinoma. (a-D) Kaplan-Meier analysis of overall survival and disease-free survival according to PKM2 expression (a and b) and PD-L1 (c and d) expression in TCGA LUAD patient cohorts. (e and f) Kaplan-Meier analysis of overall survival and disease-free survival according to the combination of PKM2 and PD-L1 expression in TCGA LUAD patient cohorts. Patients with high PKM2 and high PD-L1 levels had the poorest overall survival (e) and disease-free survival (f) than patients with low PKM2 and low PD-L1 levels or patients with low PKM2 levels alone (a and b). The log-rank test was used to determine the association between mRNA expression and overall survival/disease-free survival, and the Kaplan-Meier method was used to generate survival curves. LUAD lung adenocarcinoma; TCGA The Cancer Genome Atlas; Log-rank test, two-sided. The number of patients at risk among these groups at different time points is presented at the bottom of the graphs

