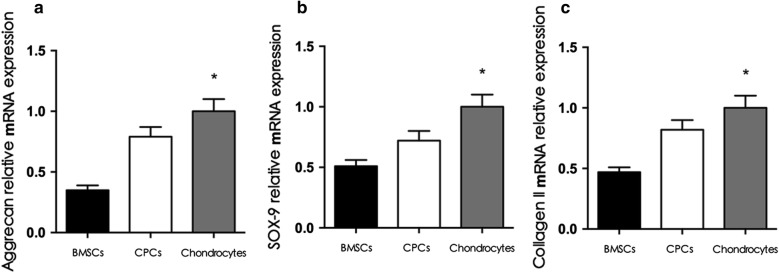
Fig. 6.
Chondrogenic gene expression. RT-PCR data showed that the relative expression of sox-9, collagen II, and aggrecan in the chondrocyte group was higher than that in the CPCs group (p < 0.05), and the relative expression of these genes in the CPCs group was higher than that in the BMSCs group (p < 0.05)

