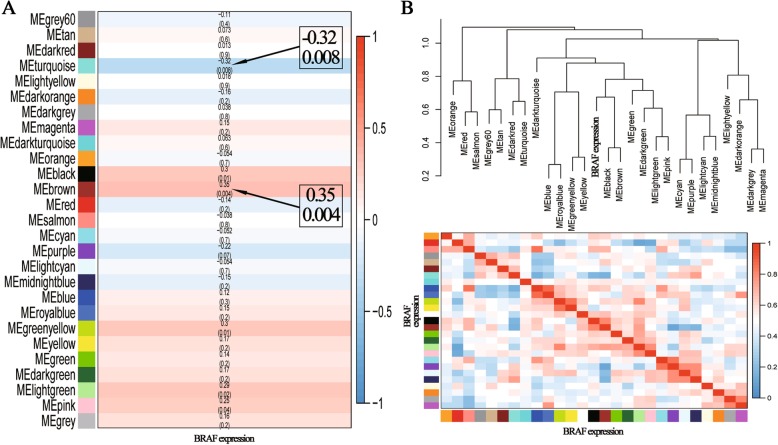
Fig. 4.
a Heatmap of module-trait relationships. The brown module was the most positive module (correlation coefficients: 0.35, and p-value: 0.004) correlated with the expression of BRAF, and the turquoise was the most negative module (correlation coefficients: −0.32, and p-value: 0.008). b Hierarchical clustering of module and heatmap plot of the eigengene adjacencies

