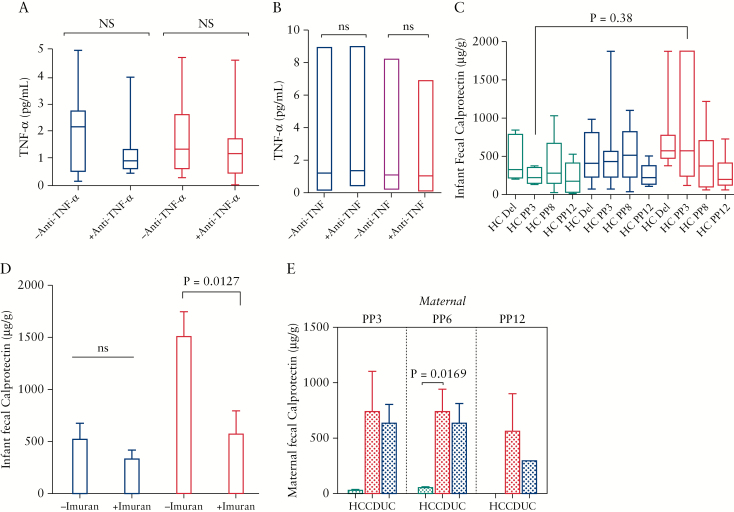
Figure 6.
The effects of anti-TNF-α treatment on TNF-α levels in serum, and FCP concentration in infants and mothers. [A] Data showing TNF-α levels in the milk, and [B] serum of mothers on either anti-TNF-α or other treatments. [C] Showing concentrations of FCP in meconium, and faecal samples of infants born to healthy, UC and CD mothers at PP3, PP6 and PP12. [D] Plots indicating FCP levels in faecal samples of infants [PP3] born to mothers with UC or CD on imuran versus other treatments. [E] Graphs showing FCP levels in faecal samples of healthy mothers versus CD or UC at PP3, PP6 and PP12. CD, Crohn’s disease; UC, ulcerative colitis; FCP, faecal calprotectin; PP3, 3 months postpartum; PP6, 6 months postpartum.

