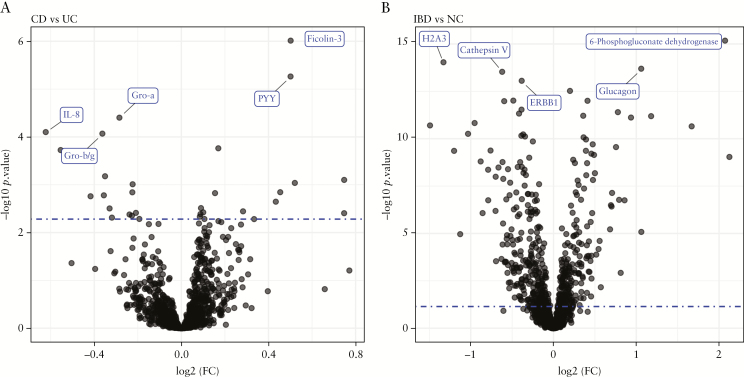
Figure 3.
Volcano plots of differential protein expression analysis. [A] CD vs UC signature. [B] IBD vs HCs signature; dotted blue line marks the empirical 10% false discovery rate [FDR] significance threshold, obtained by permuting the input dataset and repeating the analysis 1000 times. The top five significant proteins are labelled.

