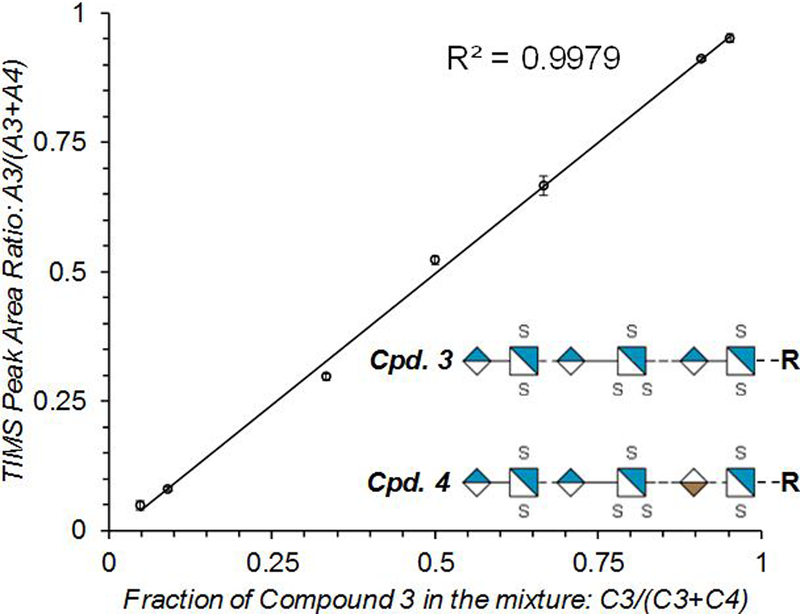
Figure 5.

Relative quantification of two dp6 stereoisomers. The peak area ratio, A3/(A3+A4), was averaged over three technical replicates, and plotted against the ratio of the concentration of Compound 3 over the total concentration, C3/(C3+C4). Error bars show the standard deviations of three measurements (generally less than 2%). Data used to generate this plot can be found in Supplementary Table S7. R = C5H10NH2.
