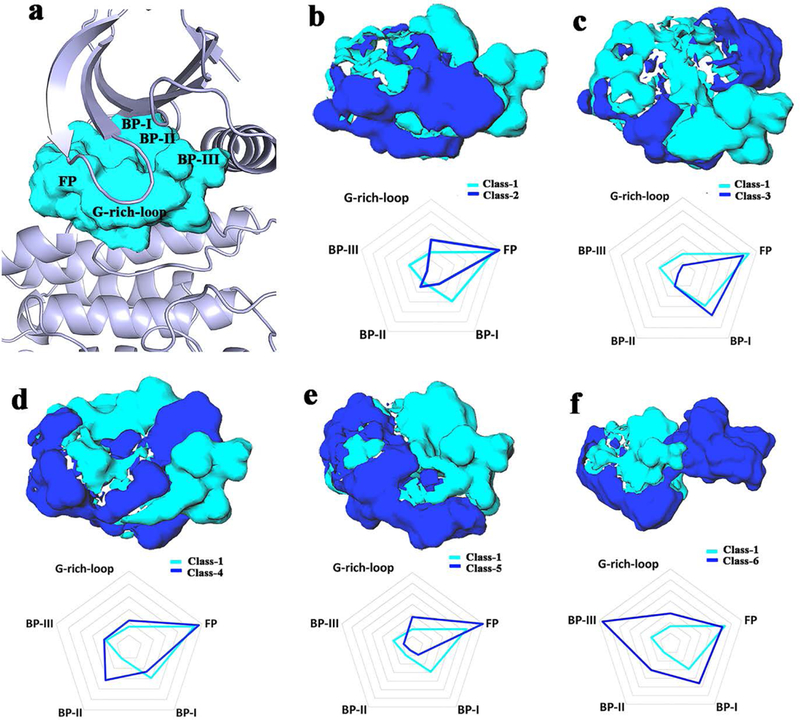
Figure 2.

Differences in binding pockets. The cavity of Class-1 is showed in cyan and the cavity of each other class in blue, respectively. (a) The Class-1 binding pocket shown in PDB 1m17 as a reference showing every region. (b-f) Significant pairwise differences (upper); quantitative difference of every pairwise binding pocket illustrated using a radar chart and a contour interval of 100 Å3 (lower).
