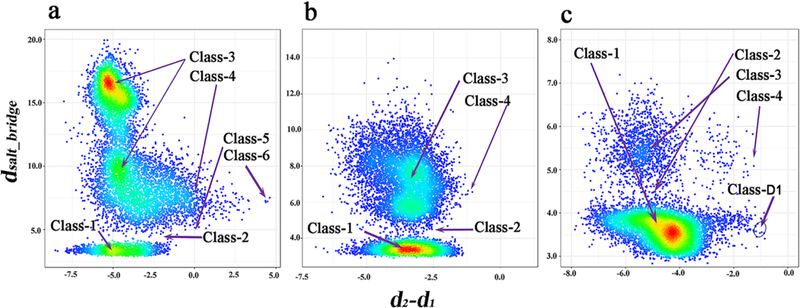
Figure 3.

Scatter density plot of the distributions of conformation space for the different systems (a) wildtype, (b) del746–750/T790M/C797S and (c) L858R/T790M/C797S. The y axis represents the distance of K745 Nζ : E762 Cδ and the x axis represents the flexibility of the DFG peptide. d2-d1=d2[C797 Cα : D855 Cγ]−d1[C797 Cα : F856 Cζ]. High-density and low-density regions are colored in red and blue, respectively.
