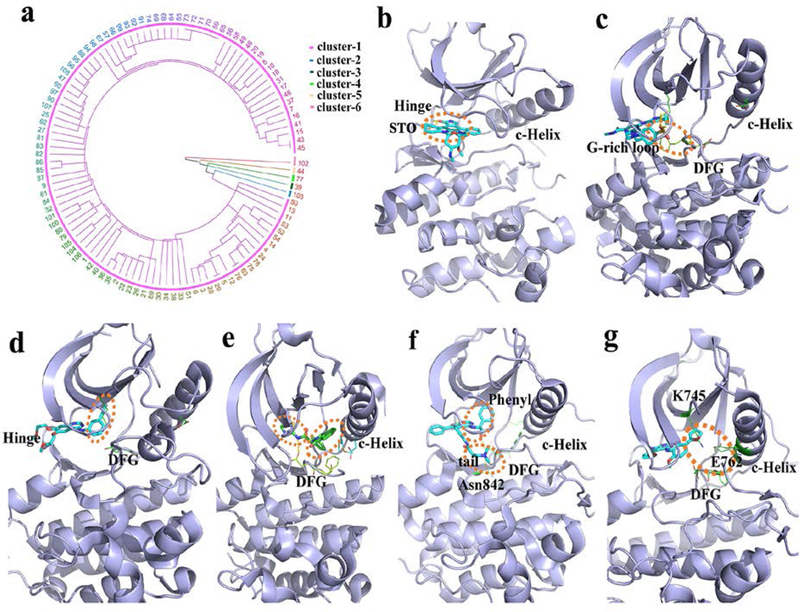
Figure 6.

EGRF ligand-binding clusters and features. (a) hierarchical cluster analysis. The number represents the index of every structure (Table S5). (b-g) the clustered binding modes (clusters 1–6) are shown using the PDB structures 2itu, 5u8l, 4hjo, 5d41, 4jq8 and 4jeb, respectively. The dash-line circles (orange) highlight the binding characteristics of the core binding pocket in: (b) the location of binding G-rich loop and DFG motif; (c) the hydrophobic pocket; (d) the hydrophobic pocket and the allosteric site; (e) the hydrophobic pocket and the location of binding DFG and Asn842; (f) and the combined binding position with the interactions from the hydrophobic pocket and the allosteric site (g).
