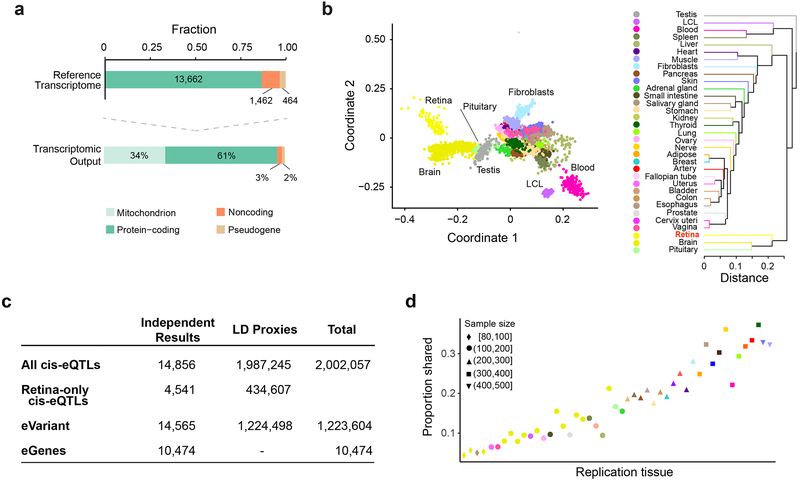
Figure 1.
EyeGEx: retinal transcriptome and eQTL analyses.
(a) Reference transcriptome output from 105 MGS1 control donor retinas. Top: Fraction of expressed genes in Ensembl gene biotypes. Below: Percentage of gene expression in distinct gene subtypes.
(b) Within-tissue sample similarity and transcriptome comparison across the retina (n = 105 MGS1 retinas) and the GTEx tissues (v7) (n = 6,421 samples across all body sites) based on normalized gene expression levels. Each color represents a distinct tissue. Left: multidimensional scaling. Right: tissue hierarchical clustering.
(c) A summary of retinal cis-eQTLs, eGenes and eVariants. 1.8% of the top eVariants (14,565) regulate more than one eGene. Variants in LD with the most significant eVariant are indicated as LD proxies. LD, linkage disequilibrium.
(d) The proportion of cis-eQTLs in the retina (y-axis) that are detected in GTEx (x-axis), ordered by the sample size of each tissue. Color and shape of each point represent the tissue and sample size, respectively.

