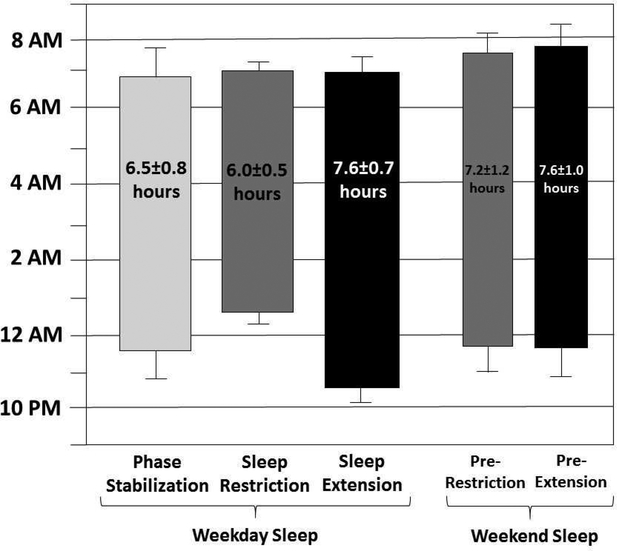
Figure 3.
title: Sleep Patterns Based on Actigraphy for Each Phase of the Sleep Protocol
Note: Mean sleep onset is represented by the bottom of each bar and mean wake time by the top of each bar (error bars representing the standard deviation of each), with average sleep duration printed within each bar.

