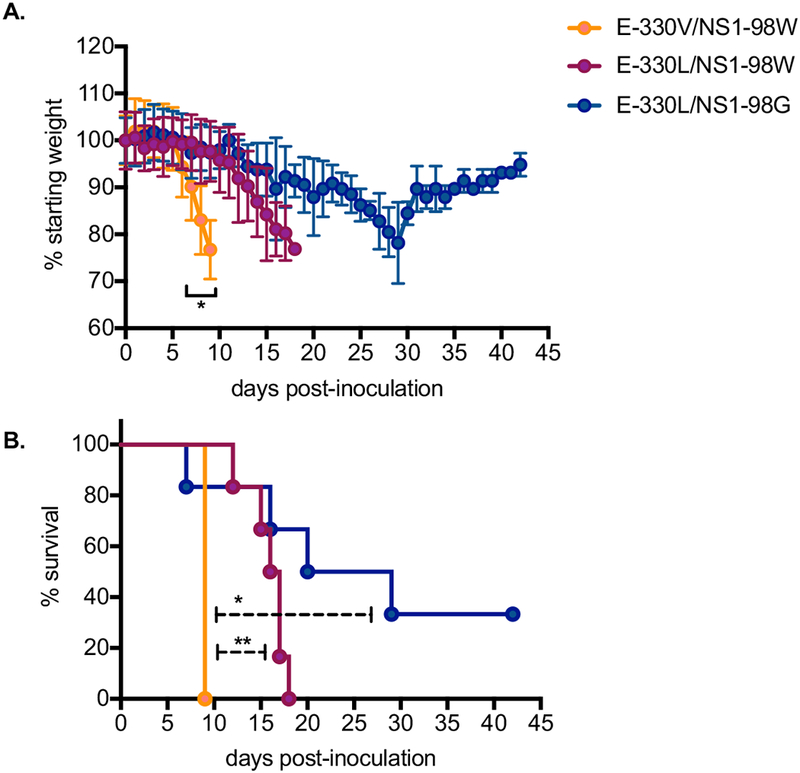
Figure 2. Morbidity and mortality of ZIKV mutants in AG129 mice.

Yellow symbols represent mice inoculated with ZIKV E-330V/NS1-98W (n=12); red symbols represent mice inoculated with ZIKV E-330L/NS1-98W (n=12); and blue symbols represent mice inoculated with ZIKV E-330L/NS1-98G (n=12). Three mice from each group were sacrificed on dpi 6 and dpi 9, such that time points after dpi 6 and 9 are representative of n = 9 or 6 mice, respectively. (A) Average weight of mice post-inoculation, represented as a percentage of initial weight. Error bars represent standard deviations. (B) Daily percent survival of mice post-inoculation. Error bars represent standard deviations. * p < 0.05, ** p < 0.001.
