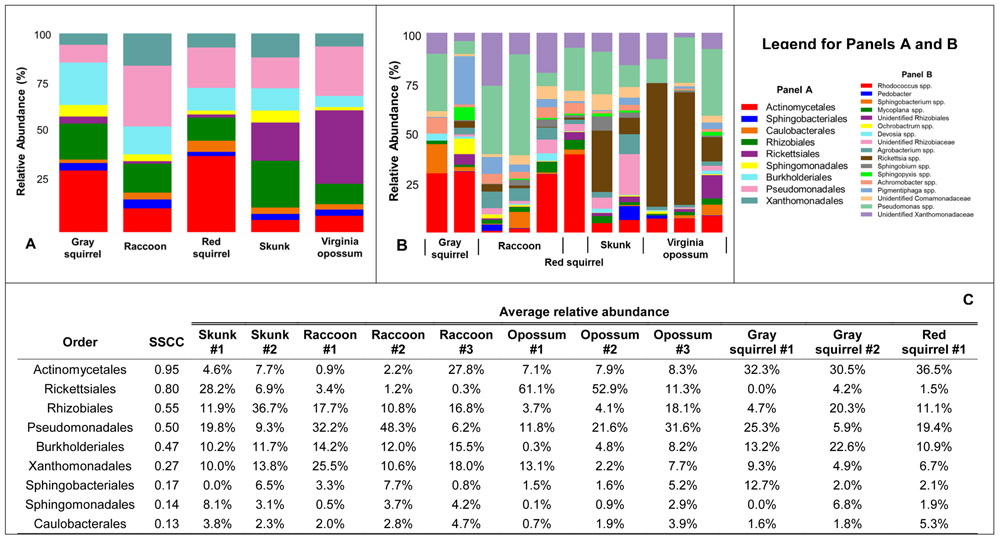
Figure 1.
Graphs of mean relative abundance of bacterial taxa associated with each host species for bacterial families (Panel A) and genera (Panel B). Genera and families individually comprising <1% of total community are not included. Panel C shows values of relative abundance at the order level. Orders are ranked by the sum of squares of their correlation coefficients (SSCC) with canonical analysis of principal coordinates (CAPs) 1 and 2 (see Figure S1 and the text).

