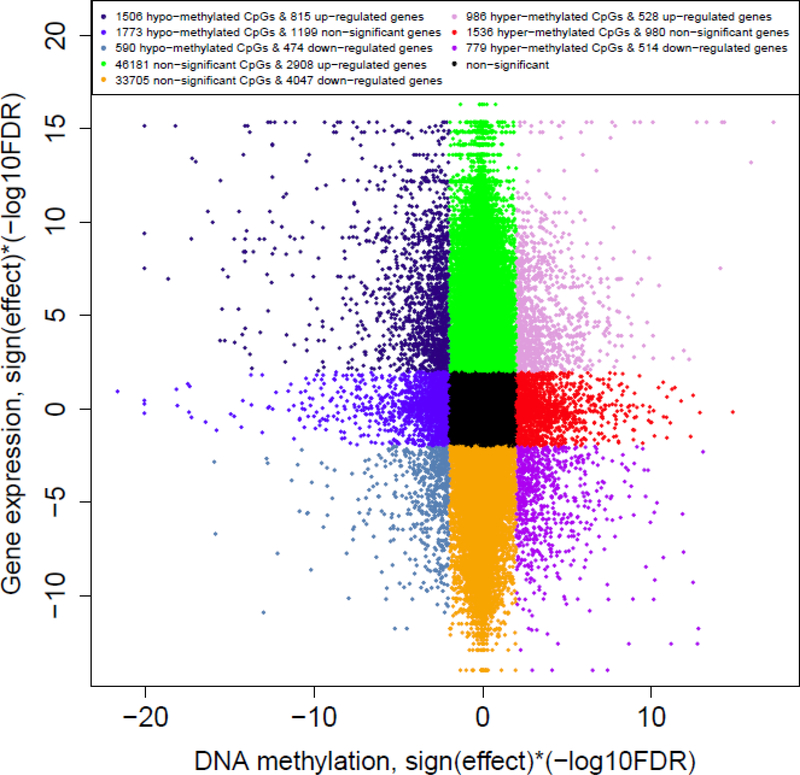
Figure 2 – Integration of Epigenome-wide Association Study (EWAS) and Transcriptome-wide Association Study (TWAS) results for atopy.
Figure shows the -log10(FDR P-value) for DNA methylation (EWAS) in the x-axis, and for gene expression (TWAS) in the y-axis; positive values indicate hypermethylation or over-expression, and negative values indicate hypomethylation or under-expression. Pairs where both EWAS and TWAS results are non-significant (FDR P>0·01) are shown in black. Significantly hypermethylated CpGs with under-expressed corresponding genes are shown in purple (right lower quadrant; 779 CpGs, 514 genes); hypomethylated and over-expressed genes shown in dark blue (left upper quadrant; 1506 CpGs, 815 genes).

