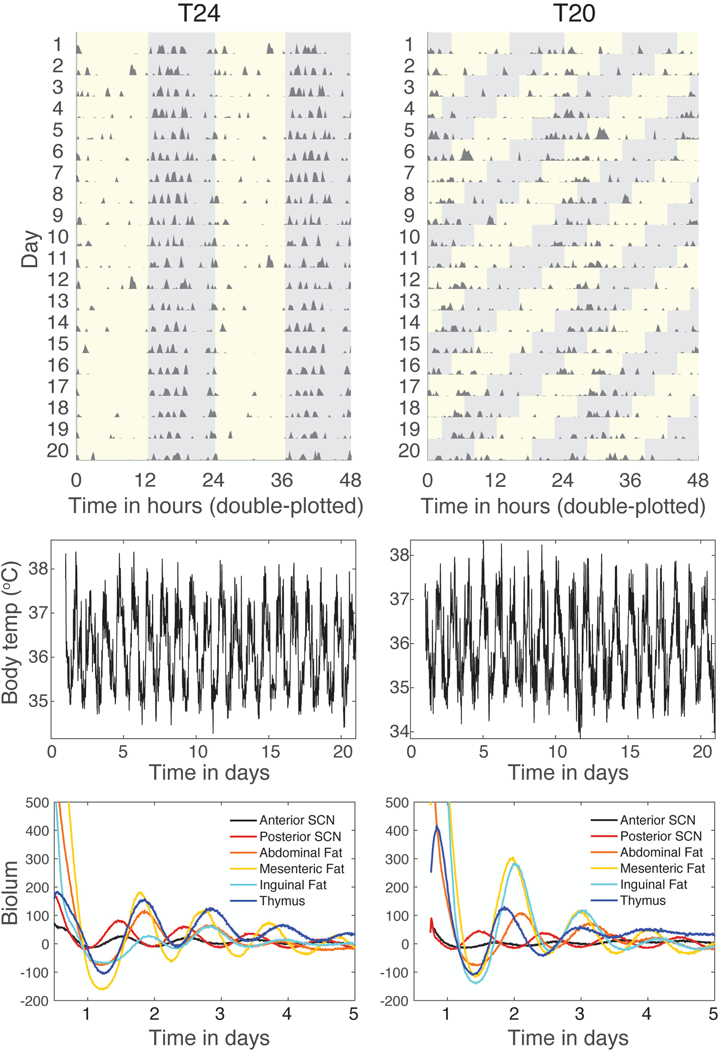
Figure 2.

Representative traces of activity, body temperature, and tissue bioluminescence for T24 (left) and T20 (right). Traces are from one animal per lighting condition. Activity records (top graphs) are shown as double-plotted actograms, with each day’s activity plotted below and to the right of the previous day. Activity data are derived from abdominal probes monitored by telemetry. Light:dark cycles are shown on the actogram by grey regions showing times of darkness. Body temperature rhythms (middle graphs) are derived from intra-abdominal probes. Rhythms in PER2::LUC bioluminescence (lower graphs) are from explant cultures of tissues sampled from these mice post-euthanasia, in counts/sec with mean value subtracted from each record.
