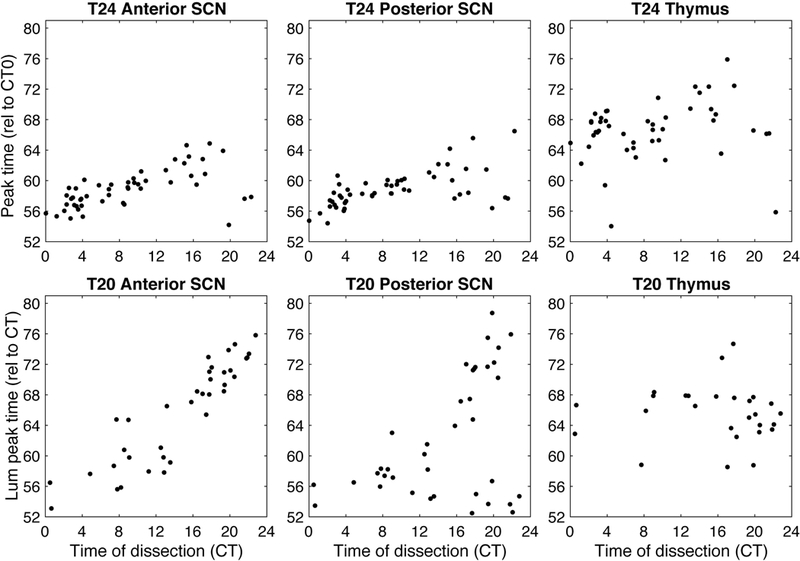
Figure 4. Mice from T24 (LD12:12) and T20 (LD10:10) showed phase of bioluminescence rhythms in SCN and thymus tissues measured ex vivo that varied with time of dissection.

Data for different tissues is shown in separate graphs and each mouse contributes at most one point per graph (excluding samples which failed rhythmicity criterion: 1 anterior SCN, 0 posterior SCN, and 5 thymus for the T24 condition out of 53 mice; 3 anterior SCN, 0 posterior SCN, and 12 thymus for the T20 condition out of 39 mice). Time of dissection and tissue peak time are calculated relative to the body temperature rhythm of each mouse, with CT0 set to 5.7 hours after body temperature peak prior to dissection.
