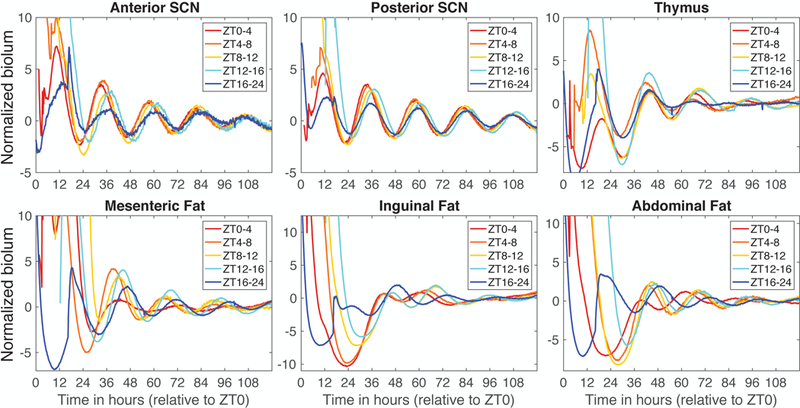
Figure 6.

Mean PER2::LUC bioluminescence from T24 samples grouped by time of dissection. Individual traces were normalized by dividing by the standard deviation before averaging within each dissection time group. Time is measured in hours extrapolated from ZT, with time 0 coinciding with what would have been lights on. Sample size for each group: ZT0–4, n=15; ZT4–8, n=10; ZT8–12, n=11; ZT12–16, n=8; ZT16–24, n=9.
