
Figure 7.
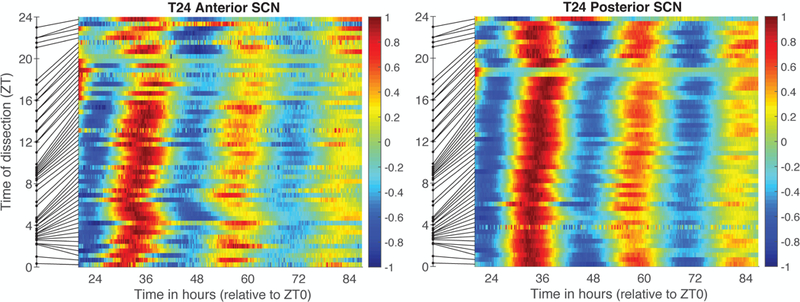
SCN samples from T24 mice ordered by time of dissection (ZT). Color reflects value of each individual PER2::LUC bioluminescence trace after linear detrending and dividing by the maximum value. Samples are ordered by the time of dissection relative to the LD cycle (where ZT0 = time of lights on). Time of dissection is shown as a dot on the y-axis and the line connects that time to the row for that sample, thus illustrating unevenness of sampling with respect to ZT. The x-axis shows time in vitro, where time 0 corresponds to last lights on (ZT0).