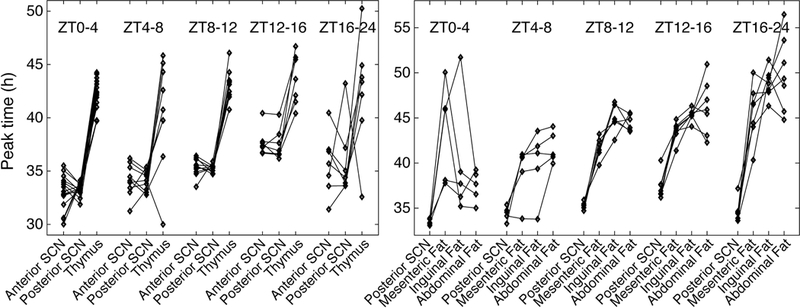
Figure 9.

Phase relationships between SCN and peripheral tissues in T24 mice. Diamonds indicate peak times of PER2::LUC bioluminescence, with lines connecting results for tissues from the same animal. Results are grouped according to time of dissection, where ZT0 corresponds to the last time of lights on.
