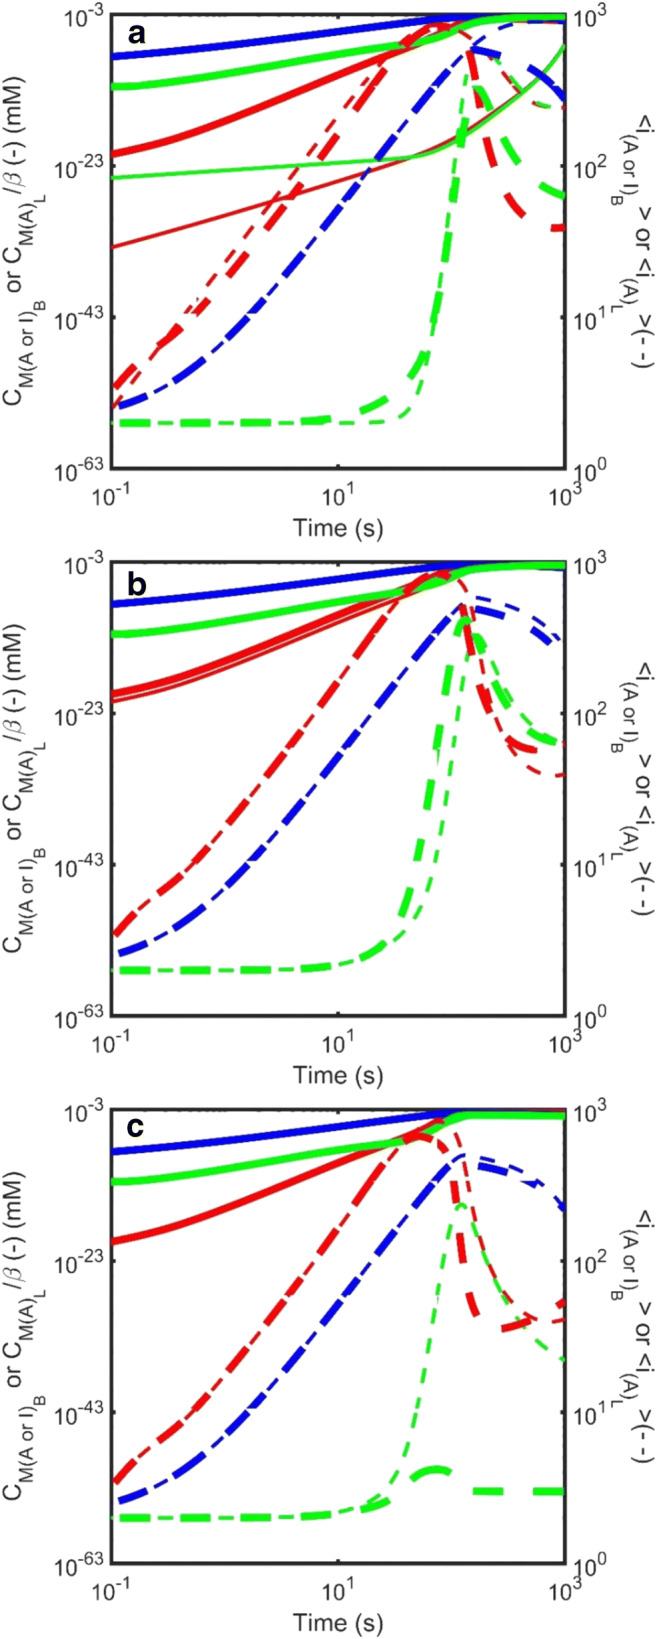
Fig. 11.

Simulated kinetics of the amyloid growth via a mechanism involving nucleation within a second liquid-like phase constituted by an amorphous aggregate (Eqn. Set 10) described in terms of the total mass concentration (solid line – left axis) and the average degree of polymerization (dotted line – right axis). Various species are depicted using different colors, with green denoting amyloid growing within the amorphous liquid phase, red denoting amyloid in the bulk phase and blue describing amorphous aggregate. a Effect of variation in the parameter describing mobility of monomer within the liquid phase, σ: The value of σ was varied between two limits, σ = 1 × 10⁻¹⁵ (thin lines) and σ = 1 × 10⁻¹⁰ (medium lines) and σ = 1 × 10⁻⁵ (thick lines). b Effect of variation in the partition rate of amyloid from the amorphous phase to the bulk phase, : The partition rate constant regulating the rate of egress of amyloid from the amorphous to the bulk phase, , was varied from 5 × 10⁻¹⁰ m.s−1 (thin lines) to 5 × 10⁻⁹ m.s−1 with 1 × 10⁻¹⁰ m.s−1. c Effect of variation in the rate of scission of amyloid growing within the amorphous phase, : The value of was varied between two limits, = 1 × 10⁻⁴ s−1 (thin lines) and 0.1 s−1 (thick lines). When not specifically varied all other rate constants set as follows – amyloid formation in bulk phase [; ;; ; n = 2]. Amorphous aggregate formation in bulk phase – [; ;; ]. Amyloid formation in the amorphous liquid phase [; ;; ; n = 2]. (Translated and reprinted with full permission from Hirota and Hall (2019), CMC Publishing Corporation)
