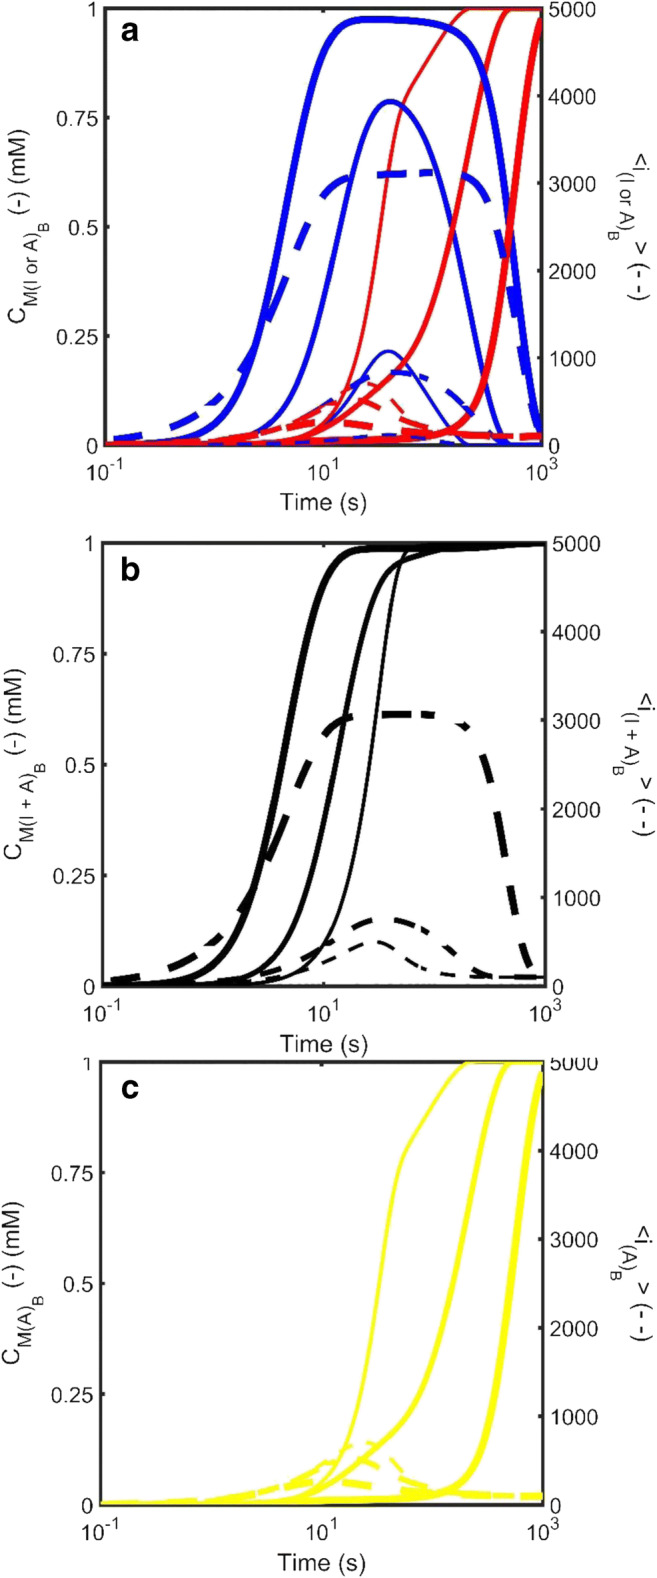
Fig. 6.

Simulated kinetics of the growth of amorphous aggregate in direct competition with amyloid for free monomer in the bulk liquid phase for three situations in which the intrinsic amyloid kinetics remain unchanged but the growth rate constant of amorphous aggregate increases (thin lines - , medium lines - , thick lines - . The three panels describe various different representations of the total mass concentration of the aggregates, and (solid line – left axis) and the average degree of polymerization of the aggregates, and (dotted line – right axis). a Species plot describing the time evolution of the properties of amorphous aggregate (blue lines) and amyloid (red lines). b Effect of measurement principle on the reported kinetics—Signal reflecting molecular weight: A common analytical procedures for measurement of protein aggregate is the pelleting assay. This assay tends to lump all forms of high molecular weight species together. Black line describes aggregate properties when amyloid and amorphous aggregate contribute equally to the signal. c Effect of measurement principle on the reported kinetics—Signal reflecting molecular amyloid only: Another common analytical procedures for measurement of amyloid is the Thioflavin T fluorescence assay which tends to not recognize amorphous aggregate. Aside from changes in all other characteristic rate constants for the amorphous system remain constant [; ; ]. Simulations were carried out by simultaneous solution of Equations 3 and 5 with the conservation relation . The amyloid kinetics were defined throughout by [; ;; ]. (Translated and reprinted with full permission from Hirota and Hall (2019), CMC Publishing Corporation)
