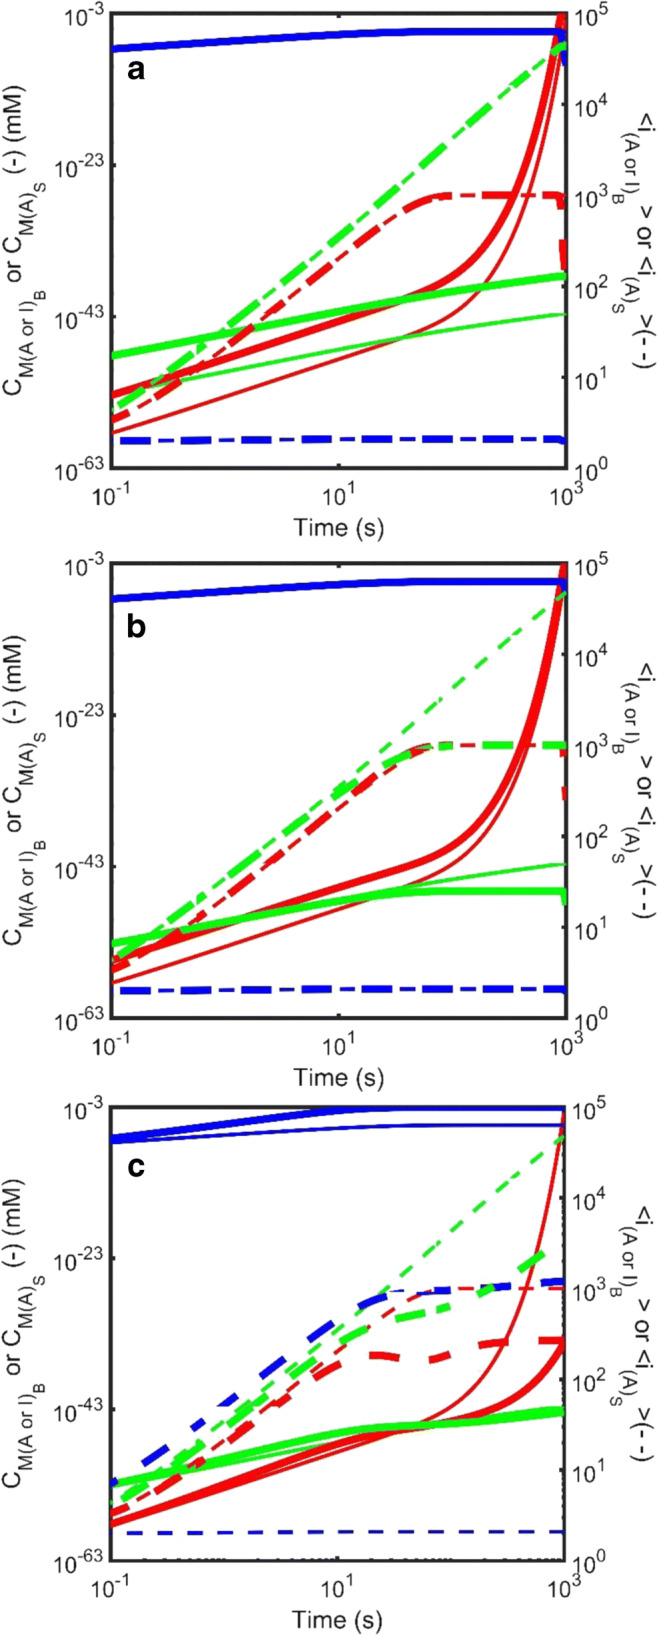
Fig. 9.

Simulated kinetics of the growth of amyloid occurring via nucleation at the surface of an amorphous aggregate (Eqn. Set 8) described in terms of the total mass concentration (solid line – left axis) and the average degree of polymerization (dotted line – right axis) for amyloid attached to the surface (green), amyloid growing in the bulk phase (red) and amorphous aggregate (blue). a Effect of variation in the number of nucleation sites per unit area of amorphous aggregate, : The parameter was varied from = 1 × 10⁻⁵ ϵmax (thin lines) to (with ϵmax defined as the inverse of the projection area of an assumed spherical adsorbing monomer, i.e., ϵmax=1/(π.R12). b Effect of variation in the scission rate of surface attached amyloid, : The scission rate constant for amyloid attached to the surface of the amorphous aggregate, , was varied from = 1 × 10⁻⁴s−1 (thin lines) to = 0.1 s−1 (thick lines). (c) Effect of variation in the rate of growth of amorphous aggregate, : The growth rate constant for amorphous aggregation was varied from (thin lines) to (thick lines). Throughout these simulations, the bulk phase amyloid kinetics remain unchanged [; ;; ] and unless specified the amorphous aggregation and amyloid surface growth kinetics were respectively defined by the following rate constant sets amorphous aggregation - [; ;; ] and amyloid surface growth - [; ;; ]. (Translated and reprinted with full permission from Hirota and Hall (2019), CMC Publishing Corporation)
