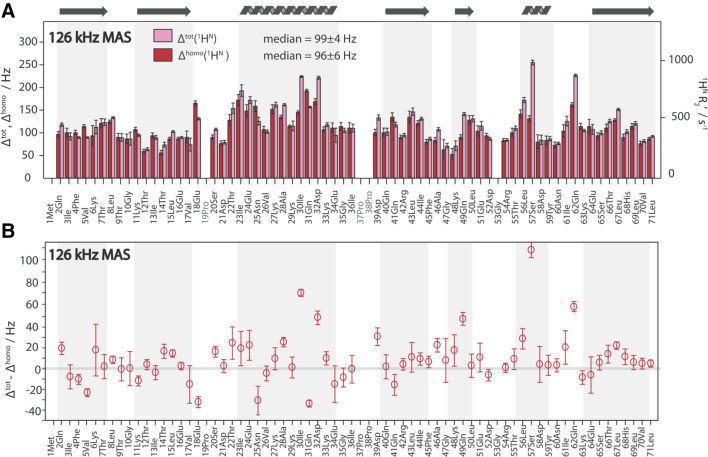
Fig. 4.
Site-specific 1HN total linewidth Δtot as well as its homogeneous component Δhomo in fully protonated ubiquitin at 126 kHz MAS (a) within a confidence interval of 95% as determined by a Monte-Carlo based error analysis (Sawilowsky and Fahoome 2003). Δhomo was obtained from site-specific R2′ relaxation rate constants measured in a series of 2D experiments with different echo delay times where the coherence decay was subsequently fitted to a mono-exponential decay using FitTrace of INFOS (Smith 2017). In addition to the median given in the figure, the mean value of Δhomo is 100 ± 28 Hz. The Δtot was obtained by fitting the 2D spectrum (processed without apodization or window function) using the fitting program INFOS (Smith 2017). In (b) the inhomogeneous contribution Δinhomo = Δtot − Δhomo is shown. Secondary structural elements for ubiquitin are displayed at the top and are indicated by grey areas

