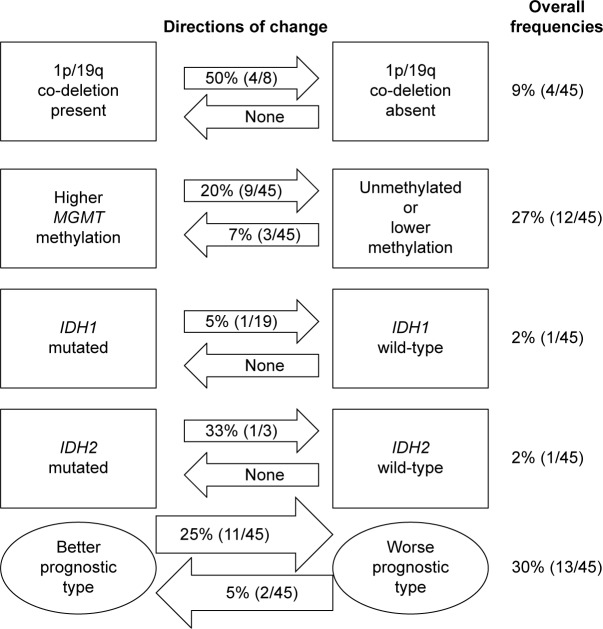
Figure 2.
The directions and frequencies of changes for each biomarker. The frequencies presented in arrows represent the percentage of changes measured within patients with a particular biomarker, while overall frequency is the percentage of alterations measured within whole group undergoing double surgery. Transformations into methylated MGMT, 1p/19q co-deletion, IDH1/IDH2 mutations, or MGMT methylation level altered two levels up were considered as change for a better molecular profile, while a profile was considered as transformation into a worse prognostic type when one of the above was no longer present or MGMT methylation decreased by least two categories.

