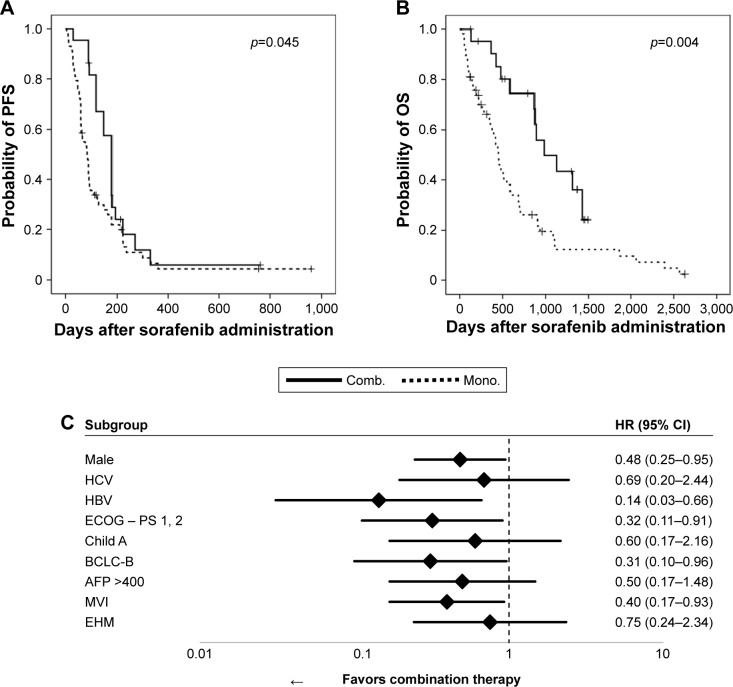
Figure 2.
Kaplan–Meier analyses of (A) PFS and (B) OS in groups of patients administered combination therapy (Comb.; n=22) and sorafenib monotherapy (Mono.; n=58). Between-group differences were analyzed by log-rank tests. (C) Forest-plot analysis.
Abbreviations: PFS, progression-free survival; OS, overall survival; HCV, hepatitis C virus; HBV, hepatitis B virus; ECOG, Eastern Cooperative Oncology Group; PS, performance status; BCLC, Barcelona clinical liver cancer; AFP, alpha-fetoprotein; MVI, major vascular invasion; EHM, extrahepatic metastasis.

