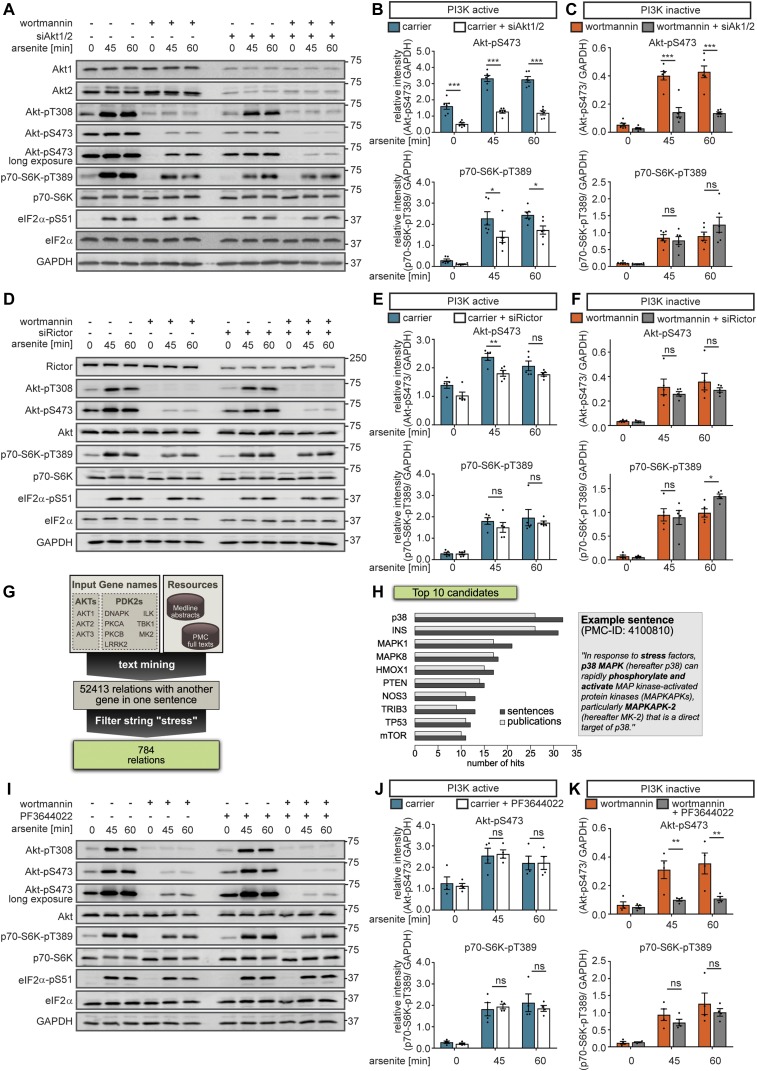
Figure 4. Stress promotes Akt-S473 phosphorylation via the p38-MK2 axis when PI3K is inactive.
(A) mTORC1 stress activation is not mediated via Akt when PI3K is inactive. MCF-7 cells were serum-starved and treated with arsenite in the presence of carrier (DMSO) or wortmannin (100 nM, PI3K inhibitor) in cells treated with non-targeting scramble siRNA (siControl) or with siRNA-pools targeting Akt1 and Akt2. Akt1, Akt2, Akt-pT308, Akt-pS473, p70-S6K-pT389, and eIF2α-pS51 were monitored by immunoblot. Data represent six biological replicates. (B) Quantification of data shown in (A) when PI3K is active. Akt-pS473 and p70-S6K-pT389 levels were compared between siControl and siAkt1/2-treated cells using a two-way ANOVA followed by a Bonferroni multiple comparison test across six biological replicates. Data represent the mean ± SEM. P-values for the Bonferroni multiple comparison tests are shown above the columns. *P ≤ 0.05; ***P ≤ 0.001. (C) Quantification of data shown in (A) when PI3K is inactive. Akt-pS473 and p70-S6K-pT389 levels were compared between siControl and siAkt1/2-treated cells in the presence of wortmannin using a two-way ANOVA followed by a Bonferroni multiple comparison test across six biological replicates. Data represent the mean ± SEM. P-values for the Bonferroni multiple comparison tests are shown above the columns. ns, not significant; ***P ≤ 0.001. (D) Akt-pS473 is not mediated by mTORC2 when PI3K is inactive. MCF-7 cells were serum-starved and treated with arsenite in the presence of carrier (DMSO) or wortmannin (100 nM, PI3K inhibitor) in siControl versus siRictor-treated cells. Rictor, Akt-pT308, Akt-pS473 p70-S6K-pT389, and eIF2α-pS51 were monitored by immunoblot. Data represent five biological replicates. (E) Quantification of data shown in (D) when PI3K is active. Akt-pS473 and p70-S6K-pT389 were compared between siControl and siRictor using a two-way ANOVA followed by a Bonferroni multiple comparison test across five biological replicates. Data represent the mean ± SEM. The P-values for the Bonferroni multiple comparison tests are shown. **P ≤ 0.01. (F) Quantification of data shown in (D) when PI3K is inactive. Akt-pS473 and p70-S6K-pT389 were compared between siControl and siRictor-treated cells in the presence of wortmannin using a two-way ANOVA followed by a Bonferroni multiple comparison test across five biological replicates. Data represent the mean ± SEM. The P-values for the Bonferroni multiple comparison tests are shown. *P ≤ 0.05. (G) Workflow of text mining approach. (H) List of top 10 identified interaction partners using the text mining approach, including an example sentence (Borodkina et al, 2014). (I) MK2 phosphorylates Akt-S473 when PI3K is inactive. MCF-7 cells were serum-starved and treated with arsenite in the presence of carrier (DMSO) or wortmannin (100 nM, PI3K inhibitor). In addition, the cells were treated with carrier (DMSO) or PF3644022 (1 μM, MK2 inhibitor). Akt-pT308, Akt-pS473, p70-S6K-pT389, and eIF2α-pS51 were monitored by immunoblot. Data represent four biological replicates. (J) Quantification of data shown in (I) when PI3K is active. Akt-pS473 and p70-S6K-pT389 levels were compared between carrier (DMSO) and PF3644022-treated cells using a two-way ANOVA followed by a Bonferroni multiple comparison test across four biological replicates. Data represent the mean ± SEM. The P-values for the Bonferroni multiple comparison tests are shown. (K) Quantification of data shown in (I) when PI3K is inactive. Akt-pS473 and p70-S6K-pT389 levels were compared between wortmannin- and wortmannin + PF3644022–treated cells using a two-way ANOVA followed by a Bonferroni multiple comparison test across four biological replicates. Data represent the mean ± SEM. The P-values for the Bonferroni multiple comparison tests are shown. **P ≤ 0.01. ns, not significant.

