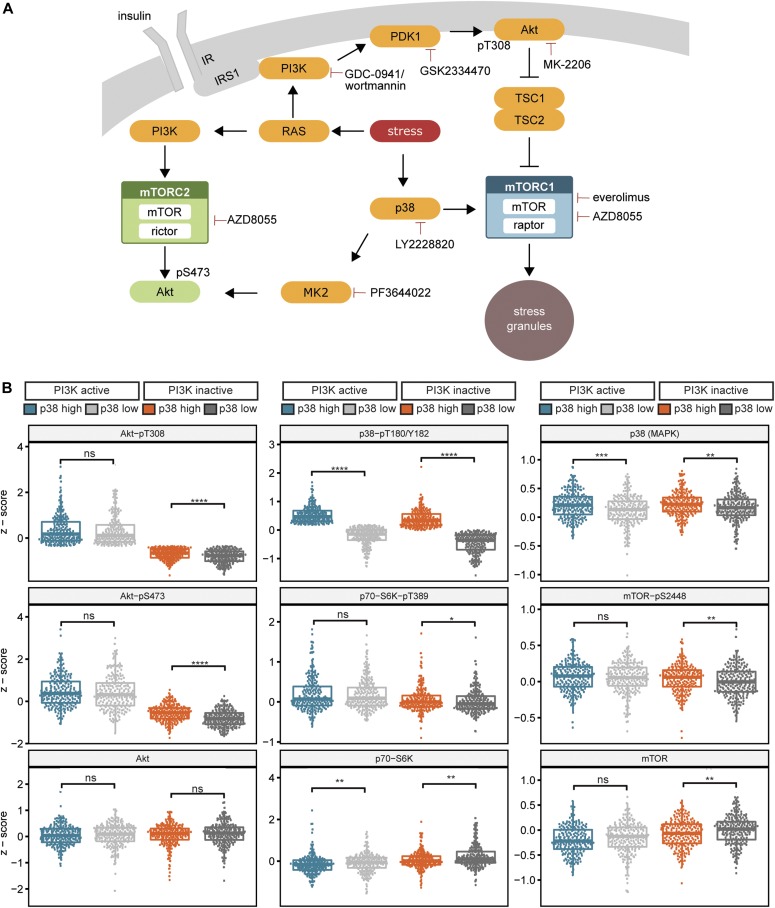
Figure 6. PI3K, p38, and MK2 transduce stress signals to the mTOR network.
(A) Scheme summarizing the stress response of the mTOR network. Three distinct cues mediate stress signals to the mTOR network. (1) Stress activates the RAS-PI3K-PDK1-Akt axis, which in turn activates mTORC1. (2) The p38-MK2 axis signals to Akt-pS473. This stress input does not activate mTORC1. (3) p38 activates mTORC1, independently of PI3K. Stress signaling to mTORC1 is required for stress granule assembly. The inhibitors used in this study are depicted. (B) p38 and mTORC1 activity specifically correlate in breast cancer tissues with low PI3K activity. Analysis of RPPA from breast cancer patients obtained from TCPA. Patients were initially divided by the median of Akt-T308 phosphorylation into two groups of (i) PI3K active and (ii) PI3K inactive. The PI3K active and PI3K inactive groups were further divided by the median of the p38-pT180/Y182 phosphorylation into high p38 and low p38 activity groups. This separated the patients into four groups, namely, (1) PI3K active and p38 high, (2) PI3K active and p38 low, (3) PI3K inactive and p38 high, and (4) PI3K inactive and p38 low. Data represent single measurements. *P ≤ 0.05; **P ≤ 0.01; ***P ≤ 0.001; ****P ≤ 0.0001. ns, not significant.

