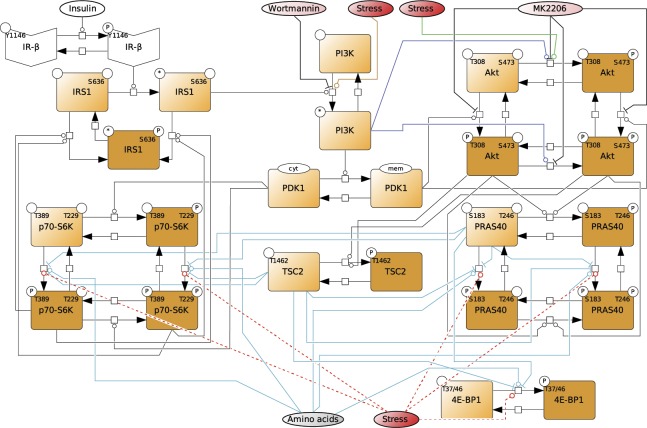
Figure S11. Topology of model V with stress inputs on PI3K, Akt-pS473, and mTORC1.
Topology of model V, having stress inputs on PI3K, Akt-pS473, and mTORC1 (Supplemental Data 5 (22KB, zip) ). Brown squares = species included in the model, circles = species variants (P, phosphorylation at the indicated site; cyt, cytosolic localization; mem, cell membrane localization; and *, active state), dark brown = observable species, species in ellipses = possible inputs to the model (insulin and amino acids) and inhibitory agents (MK-2206 and wortmannin), dark blue lines = mTORC2 activity, and light blue lines = mTORC1 activity.

