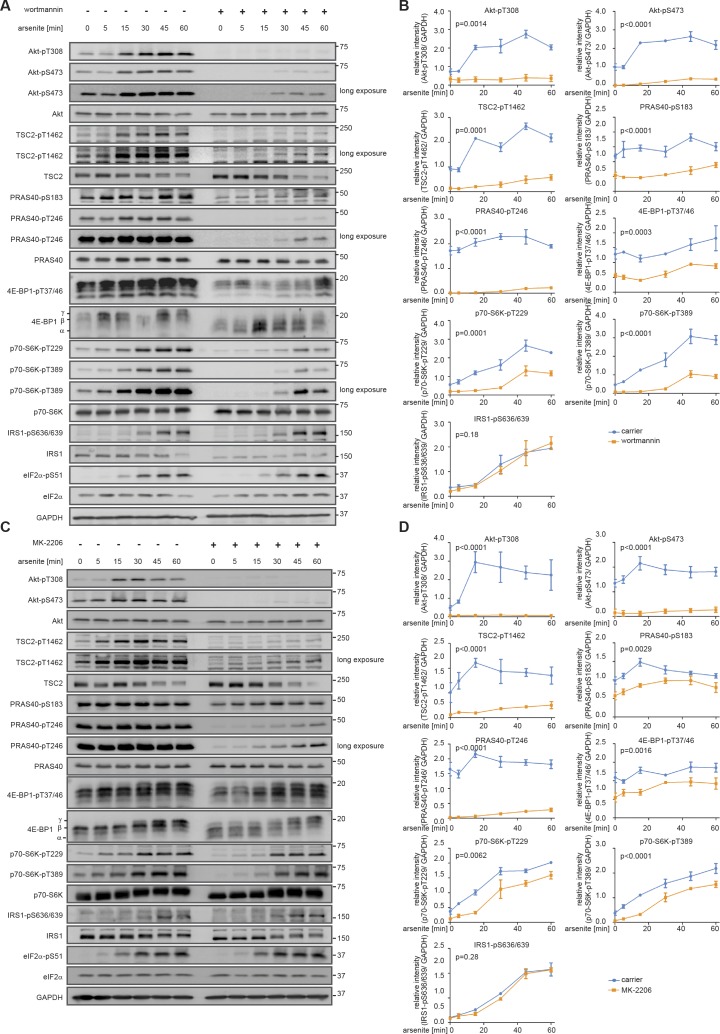
Figure S3. Perturbation datasets used for model parameterization.
(A) Arsenite time course in the presence of wortmannin. MCF-7 cells were serum-starved and treated with arsenite in the presence of carrier (DMSO) or wortmannin (100 nM, PI3K inhibitor). The mTOR network was monitored by immunoblot. All data represent three biological replicates, except for IRS1-pS636/639 (two biological replicates). (B) Quantification of data shown in (A). Data represent the mean ± SEM. The indicated phosphorylation time courses were compared between carrier (DMSO) and wortmannin treated cells using a two-way ANOVA. P-values of the ANOVA are depicted above the curves. (C) Arsenite time course in the presence of MK-2206. MCF-7 cells were serum-starved and treated with arsenite in the presence of carrier (DMSO) or MK-2206 (1 μM, Akt inhibitor). The mTOR network was monitored by immunoblot. Data represent three to four biological replicates. The number of biological replicates per readout is detailed in Supplemental Data 7 (30.8KB, xlsx) . (D) Quantification of data shown in (C). Data represent the mean ± SEM. The indicated phosphorylation time courses were compared between carrier (DMSO) and MK-2206-treated cells using a two-way ANOVA P-values of the ANOVA are depicted above the curves.

