
Figure 6.
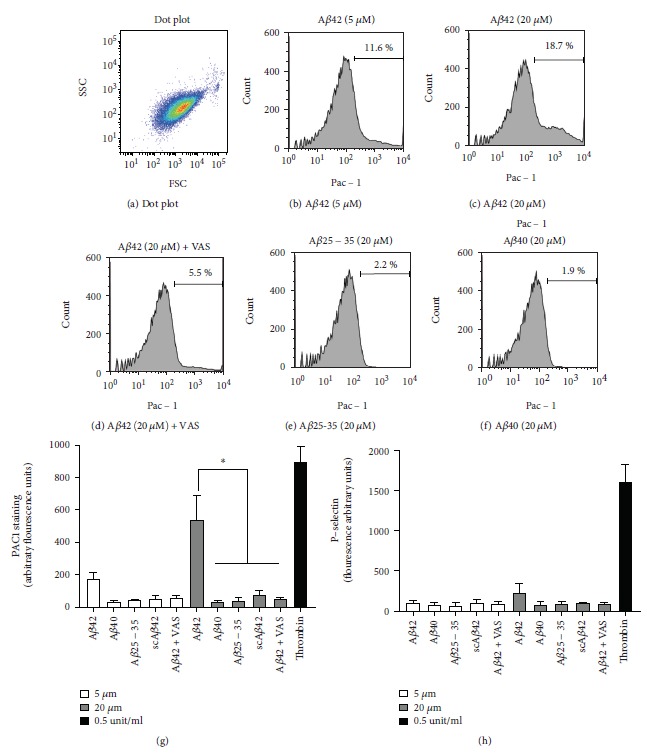
Activation of integrin αIIbβ3 by Aβ1-42. Washed platelets were stimulated as indicated with Aβ1-42, Aβ1-40, Aβ25-35, or scrambled Aβ1-42 or 0.5 units/ml thrombin for 10 minutes and then labelled with FITC-PAC1 (b-g) and PE-Cy5-P-selectin (h) for a further 10 minutes. A side-scattering (SSC)/forward-scattering (FSC) dot plot is shown in (a) and suggests the high purity of the platelet preparation. The histograms for the intensity of PAC1 staining in the different conditions are shown in (b-f) (representative of 3 independent experiments). Data analyses are shown in (g) and (h). Statistical analysis by one-way ANOVA with Bonferroni posttest is shown in (g) and (h) (n = 3, ∗P < 0.05).