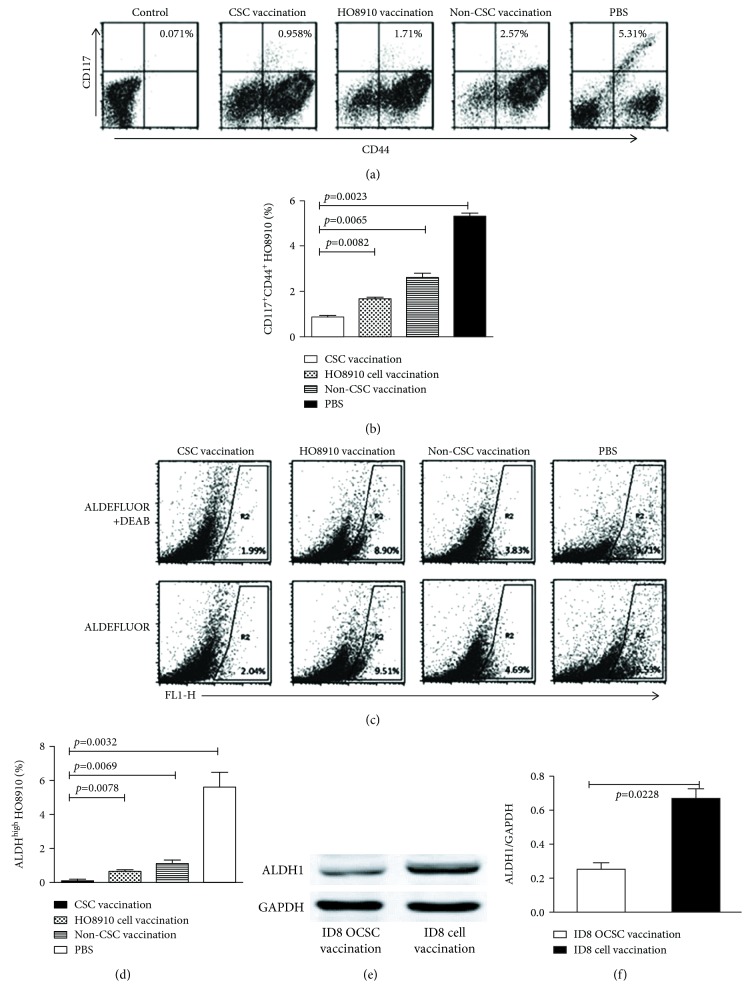
Figure 2.
Analysis of CD44+CD117+ cell and ALDH-positive cell subsets. (a) Representative FCM plots of HO8910 CD44+CD117+ double-positive cells were accounted in various groups. (b) Quantification of CD44+CD117+ cells. (c) FCM plot of 1 × 10⁶ ovarian cancer tissue cells using the ALDEFLUOR assay. The sorting gates were established based on DEAB-stained controls. DEAB were used to establish the baseline fluorescence of these cells (R1) and to define the ALDEFLUOR-positive cell region (R2). (d) Quantitative analysis of ALDH-positive cell subset. (e) Western blot analysis of ALDH expression in ovarian cancer tissues derived from vaccinated mice. (f) Quantification of ALDH expression. Statistically significant differences were indicated.

