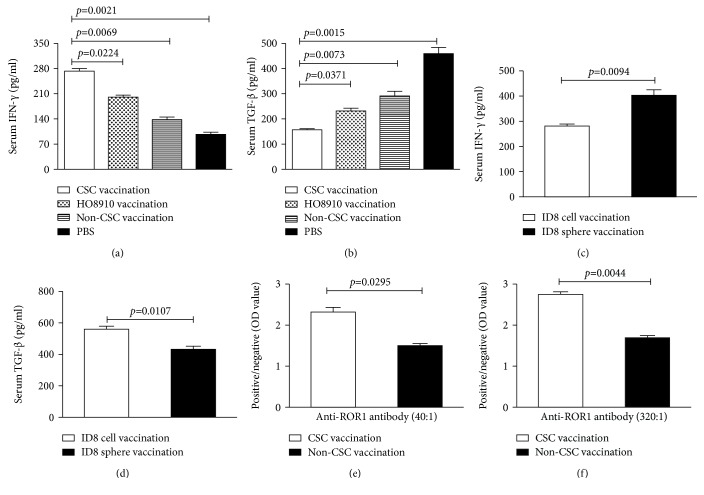
Figure 4.
The levels of IFN-γ, anti-ROR1 antibody, and TGF-β1 as measured by ELISA. (a, c) Serum IFN-γ level in the different vaccinated groups. (b, d) Serum TGF-β1 level in the different vaccinated groups. (e, f) Anti-ROR1 antibody level in the second (serum 1 : 40 dilution) and the third (serum 1 : 320 dilution) immunizations. Data are represented as the mean ± SEM (n = 12). Statistically significant differences were indicated.

